NightmareOnWallStreet
is activated again...
13 Nov 2007 On 13 Nov
I found the so called Z1 release from the Federal Reserve, it is a
treasure trove.
14 Nov 2007 We make a rough estimation of
the total housing value in the USA.
15 Nov 2007 A more detailed look in the
housing bubble + mentioning of the 'fools law' for central bankers.
01 Dec 2007 A short email exchange with
Standard & Poors chief economist David Wyss (questioning the AAA
ratings).
02 Dec 2007 Today I found out that these
weirdo's from the Federal Reserve do no longer publish M3 money growth.
03 Dec 2007 Adjusting the US economical
growth, we withdraw some borrowed money from it.
12 Dec 2007 Explaining what a 'Ponzi
financial unit' is, the entire US economy is one of those units.
17 Dec 2007 Question: Now you know what a
Ponzi unit is, is the US financial sector as a whole such a unit?
26 Dec 2007 Poking fun at Alan Greenspan
part 0001.
31 Jan 2008 Sometimes a picture paints a
thousand words.
01 Feb 2008 Need an AAA credit rating? Just
buy one!
07 Feb 2008 Do you have problems paying the
mortgage? Just walk away...
08 Feb 2008 Why USA Dubya's economic
stimulus plan will fail one 100% sure.
14 Feb 2008 The fairy tale of smart money
auctions versus protecting the money base.
22 Feb 2008 Combined US commercial bank
reserves at minus 78008 million or more.
04 Mar 2008 For the time being: US
commercial banks saved by the bell.
10 Mar 2008 Now it's official: US non
hidden debt above 50 trillion.
17 Mar 2008 Why the 20 bank rescue plan
will not prevent the meltdown of the US financial system.
09 Apr 2008 Poking fun at Alan Greenspan
part 0002.
09 May 2008 And the Paulson clown said: The
worst of the credit crisis is over now.
12 May 2008 The problem with the US GDP
reporting and the over 50 trillion debt on the economy.
15 May 2008 Some more proof that the IMF is
loosing her sharpness.
16 May 2008 And the Paulson clown said: US
economy will rebound in the second half of this year.
21 May 2008 Interview with Wall Street
investor David McCoingrab.
04 July 2008 This is funny: The DOW Jones
in Euro.
10 July 2008 US ratings agencies: It could be structured by cows and we would rate it.
14 July 2008 Has the big squeeze finally
set in?
15 July 2008
US St. Louis FED reports: Zero recessions in the last 40 years.
14 Sept 2008 US Federal bank insurance
corporation (the FDIC) has in fact zero funds.
16 Sept 2008 Google news search on
'nightmare wall street' = 478 news articles.
17 Sept 2008 Here we have that idiot IMF director general Dominique Strauss-Kahn
again.
22 Sept 2008 The explosion of toxic
debt.
10 Oct 2008 Derivatives for dummies,
updated 11 Oct with the Value at Risk model.
29 Oct 2008 For the first time in history: S&P down in a 10 year
period.
11 Nov 2008 US financial sector: Debt
growth through the decades.
30 Nov 2008 US financial sector: Prognoses
of future debt growth for the next four years.
13 Dec 2008 But is it fraud at the US FED level?
08 Feb 2009 Nice unemployment chart from the office of the Speaker.
23 Feb 2009 DOW below 7500 and declining fast...
18 June 2009 Finally a new update, reposting
& stuff like that.
08 July 2009 The IMF still does not have a clue
about the US housing market.
24 Nov 2009 The USA gross domestic product grew
2.8%, what does it mean?

Start: 12 Nov 2007, Nightmare on Wall Street activated again.
Yes my dear and beloved readers and you my slimy DOW/Nasdaq/S&P500 folks; it is time for a new decline towards the 7000 level on the DOW...
Do you think I am bluffing? No no, it is not a habit of me to bluff.
Let me show you some very advanced mathematics, it is known as 'calculation of the slope' and this a very highly advanced way of calculating slopes. May there are a few folks on American universities that may be once or twice have seen such impressive calculations..
Here below in the red graph a
total housing index is given (it is a S&P index by the way) and it
says that compared to 10 years back US housing prices have climbed with a
2.60+ factor or over 10% year on year.
Well you can do what that fool Alan Greenspan did all those years and just
shrug your shoulders and say 'So what?'.
You can also realize that housing prices should be related to median income because banks are only willing to lend some manifold of your yearly income (anyway that is what normal banks would do...).
Total US housing value is
something like 50 trillion US$ and in the triangle on the right you can
see that the present speed is something like 40 index points a year. That
amounts to something like 7 to 7.5 trillion US$ / year or over 20 billion
US$ a day.
I haven't studied the details yet but as far as I know is the 50 trillion
simply ALL US buildings so it is included private, company and government
housing... (But I have to study that detail first.)
When you take into account that the USA has 300 million citizens we see that for every citizen the decline is something like 60 to 70 US$ a day so for a family of four it is 240 to 280 US$ a day on average (for the whole of the USA, decline will vary locally of course).
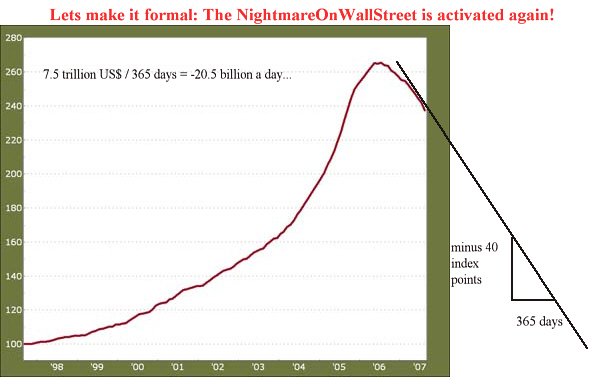
Note: The index above is the so called S&P Case Shiller index, here is the same index from the S&P website but with a few other indices in it.
As a comparison: This
declining speed is over ten times the present trade deficit...
As a comparison: There will be a 75 billion US$ fund installed to 'deal'
with the subprime problems...
As a comparison: Every four days such an 'emergency fund' will be eaten
away in terms of total housing value...
As a comparison: Unlike the currency markets where central banks can intervene, nothing can stop this housing baby...
Furthermore there will be significant problems for Freddie Mac and Fanny Mae & a whole lot of banks!
Weighing all in all I have enough ammo to reactivate my dear and beloved NigthmareOnWallStreet that was created by me on 21 Oct 2001. In those long lost years I wanted 7000 on the DOW and now I want the same number again...
But we have more: European central banker Trichet (also one of those banking fools that know nothing from economics) stated that Euro appreciation was too abrupt and too swift. Well I do not care if the money markets do it slow or fast but the new goal on the €/$ pair is 1.56.

Update from 13 Nov 2007:
May be the above mentioned
number of total housing value is too large because according to the
federal reserve total mortgages are just 10 trillion or 10 thousand billion
(that is only something like 33 thousand per capita US citizen or 130
thousand per four person household). (Source;
the so called Z1 release.)
But the average house price is now (Q3 2007) something like 300 thousand
US$, furthermore it is know that Americans have a negative savings ration
(on all kinds of levels) since 2004.
So we are to believe that the average house costs 300 thousand $ and that
four person households have an average mortgage of 130 thousand? And this
during a negative savings ratio period?
Please eat your own shit, I do not buy that.
The question is: Is that 10 trillion figure reliable? Because the same source says that total US federal debt is 4949 billion but lately the US congress lifted the Federal debt ceiling (again) to over 9 trillion... On the other hand; why should the FED lie about mortgages??? That doesn't make much sense.
If you add up all the debt numbers in the Z1 release and divide by 300 million you get 300 thousand US$ debt per US citizen. And for every percent interest they are looking at a yearly cost of 3000 dollar a year for every US citizen. Wow, that is a hefty liability and a large tax on the US economy yet the Americans have a handy way to avoid this: They reap up more debt.
Update from 14 Nov 2007:
Today I tried to find the total value of the US housing market but that was hard to find, only average prices of for example actually sold homes was at hand (300 thousand US$ it says). But with a very simple trick you can find it:
USA population size = 300
million,
Average household size = 2.59 so,
Total number of houses = 300/2.59 million = 116 million houses
Thus total market value = 116 million times 300 thousand = 116 times 300 billion = 34.8 trillion.
And if you add the value of corporate buildings, federal buildings and state buildings you easily come to 50 trillion so the above calculation is validated and indeed the decline in housing value is 10 times as big as the trade deficit.
Funny detail 1: Always when the trade deficit gets published there is much volatility on the money markets but this little housing baby that in size is ten times as big is constantly neglected... Those money traders are weird people, I can tell you that.
Funny detail 2: Yesterday it
was found on the website of the American Federal Reserve that total US
mortgages stand just over 10 trillion, but if the actual total housing
markets for house holdings stands at 34.8 trillion we are supposed to
believe that the Americans have only 29 percent of their houses as debt...
Why is this so funny?
That is because years and years ago I stated that Enron did not have it
from a stranger and I was talking about the US government, no no Bernanke
& Greenspan they did not have it from a stranger isn't it?
Update 15 Nov 2007:
Given the fact that the US Federal Reserve only has a bit over 10 trillion as total mortgage on it's files I searched a bit around about the total US housing value. With a bit of emailing and a bit of help I found that website named econstats dot com and there is a relatively reliable file (look here in the third row) that says:
23.2 trillion US$.
That is less compared to my simple estimation of 34.8 but of course the housing prices are skew in the sense you better use the median house price and not the average because the rich people pump up the average. (Statistical folks like me say: The average is vulnerable to outliers.) When you use the numbers in the third row you get the next table of year on year US housing value increase:
| Year | Cumulative | YOY percent growth of housing values | Cumulative | YOY mortgages growth |
| 2007 | 158% | 5.1% | 187% | 8.3% |
| 2006 | 146% | 10.8% | 165% | 12.6% |
| 2005 | 121% | 13.2% | 135% | 13.3% |
| 2004 | 95.8% | 11.5% | 107.5% | 13.6% |
| 2003 | 75.8% | 10.0% | 82.7% | 14.4% |
| 2002 | 59.6% | 8.7% | 59.7% | 11.4% |
| 2001 | 46.8% | 9.0% | 43.4% | 5.3%* |
| 2000 | 34.7% | 9.4% | 36.1% | 8.7% |
| 1999 | 23.1% | 9.1% | 25.2% | 9.3% |
| 1998 | 12.9% | 7.5% | 14.6% | 8.0% |
| 1997 | 5.0% | 5.0% | 6.1% | 6.1% |
|
The 2001 5.3% is caused by
going |
||||
So this is a yearly grow over the last decade of 2.58^0.1 = 9.94%. S&P Case Shiller index says 10.05% so everything looks good nailed down. And for average mortgage rising we have: 2.87^0.1 = 11.1% year on year.
(According to the Federal Reserve we have 10 trillion outstanding mortgages, so per US household that would be 87.5 thousand US$. Is that figure correct? Because it looks a bit low... Of course we have to take into account that not all household actually buy a house, we have that trailer trash and people who rent also.)
Problem is and stays: Where have all those billions gone? Well they are in the fiat money grave yard where all other bubbles lay burried...
Do we have an application of the 'fools law' for money growth? The fools law says:
M3 MONEY GROWTH - GDP GROWTH = BUBBLE GROWTH
Has the former director of the Federal Reserve (the fool Alan Greenspan) really done this horrible act? Doesn't he know that house prices need to be tied to median income and that given the present constellation with central banks, the guarding of this tie is automatically a responsibility of central bankers?
What has that Greenspan idiot done? Just look at the table above, this is horrible. This is a disaster waiting to crash down in a horrible way. Why did Alan do this? Why?
Could it be that the demise of
Enron was only a small quarter to this? Didn't I say it that Enron did
have it's accounting practices not from some stranger? Isn't it well known
that large amounts of spend federal money never make it to the official
deficit? For example all the costs of the wars in Afghanistan and Iraq are
so called 'emergency spending' and so that stays out of the official
deficit.
Now this would not be a problem if such 'emergency spendings' could be
found somewhere but I cannot find them on the official website of the
Federal Reserve and so we do not know what hangs above the markets in
terms of total US federal debt.
It might very well be far over 100% of Gross Domestic Product and therefore it could explain that weird remark that present vice president Dick Cheney once made: 'Deficits don't matter' By the way, the CEO of Parmalat (the European Enron) has stated more or less the same: 'Debt doesn't matter' and these days both Enron and Parmalat are wiped from the map.
Lets end this update with a very nice quote upon so called Ponzi finance units (found it on the Winter blog)
Ponzi’ finance units must increase outstanding debt in order to meet its financial obligations.” - Hyman Minsky
In America there are lots of Ponzi finance units, for example most households have a negative savings ratio since 2004 and the entire federal government is also a Ponzi finance unit. I do not know it the US states are Ponzi themselves, very likely they are but I have no proof for that right now.
Till updates.
Update 01 Dec 2007:
I had a brief email exchange with the Standard & Poors chief economist David Wyss, well David is ok since he even took some time to answer me contrary to the Pentagon that never ever answers any email...
Well, lets just quote what I have to say to David because I think that the US government bonds do not have AAA rating. What the exact rating acually is, I don't know because that is a specialized task for rating buro's like Standard & Poors.
Here is my first email, quote:
And this is what David replied:
David Wyss
Chief Economist
Standard & Poor's
55 Water St., 33rd Floor
New York, NY 10041
212-438-4952
David_Wyss@SANDP.COM
But since this does not take away my central reasoning I emailed the next to David:
(The actual email has disappeared from my computer, I do not know how this did happen nor did I delete it myself because I wanted to save an extra copy of it. So I will write down a few words from the lengthy email that contains my central reasoning point.)
The 46 trillion total economical debt has a reasonable 5% interest, 5% of 46 trillion = 2.3 trillion US$/year.
That is 2.3/14.6 = 15 to 16% of the gross domestic product (the US GDP).
After my humble thinking, 15 to 16% of GDP is far beyond the total after tax profits from the US economy.
So it has been proven: The US economy is a so called Ponzi financial unit (meaning that only via more borrowing they can pay the daily bills). To put it simple: They are broke so it cannot be that US government bonds have AAA rating since it has junk status.
45 minutes after updating the above: Oh, this is funny: the email I did sent was strangely not found anymore on my computer so I was wondering if it was properly sent. Well, now I have the next from David (automated message):
I will be back in the office Monday, December 10.
Ok, I have no problem with that. It means my email has arrived there where it should be and of course it is a bit difficult to downgrade the US Federal bonds from AAA to junk status. I understand the pain, I understand my beloved Standard & Poors employees...
Title:
I understand the stuff needed so take
your time my dear S&P.
__________________________
Update 02 Dec 2007:
Question of the day:
What is the core business of a central bank?
Answer: To set the overnight intra bank lending rates and defend these rates with more/less M3 money supply.
Example: When this rate is around 4.30% while the central bank has said it has to be at 4.25% than extra so called M3 money is pumped into the system until there is 4.25% again.
So therefore the M3 money supply is an inportant piece of information for economists because with those figures at hand they can calculate if some sectors of the economy are over-or-undervalued. You can apply the law of fools when you have access to the M3 money figures.
There are more than one version of this law of fools, my favorite is the first one:
M3 money supply - GDP growth = bubble growth.
And for those who believe that moderate inflation is actually a good thing for the economy and even think that the central bank has to finance such moderate inflation we have:
M3 money supply - GDP growth - inflation = bubble growth.
Whatever your economic school you believe in, you need access to the M3 money supply figures. Transparency is an important thing.
So what did the US Federal Reserve? Quote (source):
M3 does not appear to convey any additional information about economic activity that is not
already embodied in M2 and has not played a role in the monetary policy process for many
years. Consequently, the Board judged that the costs of collecting the underlying data and
publishing M3 outweigh the benefits.
Comment: This quote is absurd, suppose
that Wall Mart would state the next:
We no longer calculate the total of turnover and total profit because
there is no additional information in that that can not betrieved from the
actual number of sold bars of chocolate and kilo's of peanut butter.
Consequently the Board thinks that the cost of collecting these data
outweigh the benefits of collecting such data.
Now, would you buy stock in Wall Mart if they only published quantities?
In case you never heard of M3 money, this is how it works:
M1 money is the money you have in your
pockets and on your bank account, you can actually touch it in the form of
coins and bank notes and it exists as electronic money in your bank
account.
M2 money is the money between commercial banks, it is pure electronic.
M3 money is money from the central bank to the commercial banks.
Furthermore, the Federal Reserve is lying because with a very simple calculation you can see that:
|
The three levels of money supply over a two year period. (source, the H6 release) |
||||
| Year/month | M1 | M2 | M3 | |
| 2003/Nov | 1297.8 | 6081.6 | 8885.0 | |
| 2005/Oct | 1367.6 | 6626.7 | 10057.5 | |
| % change | +5.4% | +9.0% | +13.2% | |
And you see; the most important bubble
measure (the M3 money supply) is needed very much because if you cannot
pay normal economical growth with it you start speculating with it. For
Oct 2005 the difference M3 - M2 = 3430.8 billion US$ is money that is used
in speculation by commercial banks, remark that this 3.4 trillion is not
backed by any asset or so.
May be now you understand as why commercial banks do not want to lean
money in between them because the profits and losses of this 3.4 trillion
are often off balance...
So it makes we wonder: Why did the US Federal Reserve stop publishing these data because since it is their job to sell M3 money so they have an administration already so there are almost no additional costs to be made?
Title:
I do not understand this weird stuff
my dear US Federal Reserve.
For reasons of being complete:
--Here
is the first anouncement that M3 figure will disappear, while
--Here
is the actual deed and
--Here
is the last H6 release with M3 money in it.
Am I overstating when I say we have
Enron all over again but now on a much larger scale?
I don't think I am overstating because defending the overnight rates is at
the core business of what central banks do, so what's the real reason for
withholding this information? Very likely the M3 money supply has run
further out of hand, that is the most likely explanation because numbers
like 13.2% growth indicate extreme weakness in a mature economy. The
latest figure from Europe indicated over 12% M3 money growth year on year
so likely it is even larger in the USA. (And
therefore it is important that we kill or execute European central banker
Jean Trichet because our economy is now spoiled for no reason at all...)
When Enron collapsed and their weird accounting techniques came to light I already said that Enron did not have it from a stranger but only now it is exposed that most commercial banks have off balance 'assets' too. Therefore as an investor you can never judge the state of a bank by looking at it's balance because the whole building can be packed with invisible skeletons in hidden closets...
Update 03 Dec 2007 : Adjusting the US gross domestic product.
Treasury Secretary Henry M. Paulson, Jr. is a very funny guy: he often states that the US has a strong economy and that they have strong economical growth. He often makes me laugh because sometimes I even think he means it (but standing outside reality is a common trait in a Ponzi financial unit where the costs of interest can only be paid by more debt).
Title:
A funny clown from team Dubya.

Why not take a look at the
'strong' economical growth in the USA?
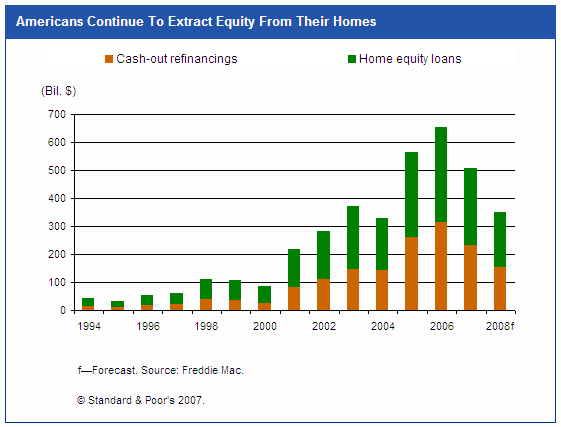
We all know that the American economy is a so called consumers economy,
that is reflected in the fact that about 70% of the gross domestic product
comes from consumer spending. Where does all that consumer spending come
from? It comes from a variety of sources, for example wages, creditcard
debt, may be interest on savings or that what is known as a line of credit
on your house. The last is some kind of credit card and since it is backed
by your house value the interest is far lower compared to a normal credit
card.
In the picture below you can see about what kind of money we are talking; for example 650 billion US$ in the year 2006.
But 650 billion US$ equals to something like 650/14600 = 4.5% of the gross domestic product. Since this part of the consumer spending is paid with debt it is not a real part of the gross domestic product.
The 2006 USA GDP growth was something like 2.6% if I remember it correctly, the easy to understand calculation yields:
2.6 - 4.5 = -1.9% over the entire year.
Thus in reality the Americans would have had a recession over the whole of 2006 in case they would not have borrowed 650 billion from their bubbled housing value... Would you invest in such a country?
I hope that my reader is capable of understand the real 'strenght' of the American economy if you understand the above reaping of more debt. It is a shit economy because once that debt is being paid of we will see many years of economical contraction. May be there will be a funny name for it: A Paulson correction.
Update 12 Dec 2007:
For some time there is talk about a so called 'Minsky moment' and yesterday for the first time it was mentioned on the Dutch television. What is a 'Minsky moment'? Well that is very simple, it is the moment you crash through the ice when winter inevitably turns to spring. In financial terms: It is the point where folks want their money back that they have 'lended' or 'invested' or 'saved at a triple A rated bank', so it is the point in time where suddenly everyone sees that it is not winter any longer and so building your home on ice is not a smart move right now.
Not often do I call names, but the economist Minsky had a great mindset and his insights saved me a lot of time to understand the present situation in the financial markets. I understood back in 2004 that we will see the biggest crash in history but I did not had the vocal points to score.
Lets look at how Minsky looked at paying off the debt:
--You have hedge funds that
can pay the interest and even the loan they have from you,
--There are hedge funds that can pay the interest but not a penny of your
loan towards them is paid back,
--Existence of hedge funds that need more loans to pay the interest is
observed.
The last is also known as a 'Ponzi financial unit'.
Luckily for me I can now proof that the entire US economy is nothing but a Ponzi financial unit and therefore the likelihood of an impending 'Minsky moment' stands at a 100%.
All that is left is timing, when will the US economy crack through the ice?
When exactly will it crack now that I have calculated a few days ago that we need over 17% of the US GDP to pay for the interest on the entire US economy?
That's it for this entry, see yeah!
Update 17 Dec 2007: Question: Now you know what a Ponzi unit is, how about the US financial sector as a whole?
Honor goes to those who
deserve the honor and it was Russ Winter from the Winter blog that brought
to my mind the concept of a so called Ponzi financial unit. I already
understood it all yet I did not have the words to speak it all out.
Here is the quote as I found it on the Winter
blog (a very good blog!), quote:
Ponzi’ finance units must increase its outstanding debt in order to meet its financial obligations.” A transition occurs over the course of an expansion as increasingly risky positions are validated by the booming economy that renders the built in margins of error superfluous - encouraging adoption of riskier positions. Eventually, either financing costs rise or income comes in below expectations, leading to defaults on payment commitments. –Hyman Minsky
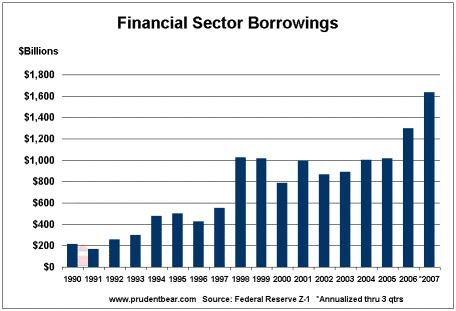
To put it simple: A Ponzi unit (consumer / company / sector of the economy / an entire economy) has to borrow money to pay for the interest on old borrowed money. We already know that the US economy as a whole needs above 17% of it's entire gross domestic product to pay for the interest on the entire economy, but how about sectors of that economy?
Here below you see more of that 'Z1 release' stuff, this time not in tables but an easy to understand graph:
You see that this year the US financial sector needs about 360 billion US$.
So my dear reader, you can judge for yourself: Are they Ponzi or are they not Ponzi?
Update 26 Dec 2007: Poking fun at Alan Greenspan part 0001.
A few days back I was looking at that boring CNN channel and that most smart CNN guy Wolf Blitzer was on it. The benefit of Wolf Blitzer is that he is less stupid than the rest of the CNN journo's.
Wolf had a highly valued guest on his show: Former central banker Alan Greenspan.
Well, since I already knew that Alan does not have the mental capabilities of calculating/ estimating the bubble size in the US housing market, it was nice to see smart ass Wolf asking questions at Alan about the present crashing situation.
This is how Alan explained the present situation:
There is a large inventory of
unsold new houses, this is twice the normal amount.
Therefore home builders will sell those houses at fire sale levels.
This brings prices down.
Although I have having a great time, suddenly Wolf ended the interview! And we had only one may be two minutes of interviewing the great Alan Greenspan!
Oh oh oh, back in 2004 I already understood what would happen and so I decided to shut up and wait for the enemy to weaken more and more. The longer you study them the more you understand of how stuff works in that fatbag obesity country.
Ok ok, let me one more time explain how to calculate the bubble size in housing markets:
Housing prices should be tied to median income, the reason for this is very simple: Commercial banks are only willing to give you some multiple of your yearly income as a mortgage. In order to avoid catastrophic stuff, central bankers should pay attention to that detail (they don't do this by the way, not in the USA and not in the UK).
The last 10 years US housing prices rose just over 10% a year while the median income only grew with the consumer inflation, something like 3% a year. The missing 7% was bubble money and over a 10 year period of time we have 1.07^10 = 97% extra bubble stuff from where we started (we started with a robust 100% true value).
Therefore something of half the average US housing price is bubble stuff.
In reality stuff is a bit more complicated because you must not only look at the median but also at the quarters or even the decades or the percentiles. Below you see in the picture that for the median thing there is less than 50% of bubble and that is because the bubble is skew as we staticians say. That means the more expensive the house and or neighborhood, the larger the bubble is.
At last it has to be remarked that the consumer inflation is calculated away in the below picture, you can see that in a blink of a second because the housing prices are 'flat' in the 1975 to 1995 period. (In my vision central bankers who endorse small amounts of inflation should be executed or killed via spontanious action from the public, this aside).
The pic below says it all, so let it blow let it blow let it blow...
Update 31 Jan 2008: Sometimes a picture paints a thousand words.
Sorry I am that lazy my dear reader but it is about time for an update of this file!
There are dozens and dozens of objects to pick up and write about but today we keep it simple so we do not talk about difficult US commercial combined bank reserves that are 9 billion negative now. No, we take a look at the relation between sold new homes and economical recessions.
It looks reasonable to expect a strong correlation between them: when there is hardship in the economy and lots of people fear for their job and are faced with much inflation you do not buy a new home that fast.
If you click on the picture below you see a very clear relation and it also suggests that there is a hefty one comming in the USA. Why the Americans try to fight it off is not known to me; recessions are an integral part of the economical cycle just like sleep is in you normal life. And today US pop singer Britney Spears was hospitalized because she had not slept for many days, she's in hospital right now so all we are waiting for is the US economy going 'Britney'.
In the picture below you see some grey parts, they indicate recession times. Click on the picture to get the big thing:

Sometimes one picture paints a
thousand words &
Sometimes one word speaks a thousand pictures but
I do not care because I want emotion to be there &
Taste of defeat in the mouth of the US military,
That's what I want and I have waited long enough...
At last: It is very weird but also funny to observe that so called TIC's data stay strong, the TIC's measure the capital flows to and from the USA. The last were a 150 billion towards the USA so most people with too much money and too little brains still do not understand what will happen over there. I can't care less; when you invest in America you also have friendly feelings for them... These people do it all to themselves, it is their problem and not mine.
Update 01 Feb 2008 : Need an AAA ranking? Just buy one!
This week one of the large bond insurers was downgraded in credit rating from AAA to AA; although Wall Street was spooked at first I thought is was not a big deal very much. But then it was found out that bond issuers can actually buy themselves AAA ratings on their issued bonds (so they are cheaper that way). Here is the quote as found on Nasdaq dot com:
Bond insurers agree to pay principal and interest when due in a timely manner in the event of a default -- a $2.4 trillion business that offers a credit- rating boost to municipalities and other issuers that don't have AAA ratings. Without those top ratings, insurers' business models may be imperiled.
You understand: the bond issuers suck in all the risk and this is no problem if they have deep deep pockets. But we also understand the nature of the game: price competition between the bond insurers and thus in the long run an unhealthy mountain of risk. With other insurance there are always things like 'when there is catastrophe (like earthquakes or volcano stuff) this is not insured' but these bond companies have no such clausules.
Just another weird detail in the US economy; bond insurers that in fact sell AAA ratings.
Update 07 Feb 2008 : Do you have problems paying the mortgage? Just walk away...
This is about the Californian housing market only (but California was one of the biggest climbers the last 10 years) and it is about this weird weird website named YouWalkAway.com. The first time I visited that website I was only thinking 'this is a parody' this is just some comics that is not for real. (I found the walk away website via the Russ Winter blog.)
But it is for real, for example Russ Winter explains:
"Via Californian law, if you face a foreclosure and you bought your house for 200,000 US$ and after the auction of your house it is sold for 170,000 US$ the gap is not to be paid by you. You can walk away and the 30,000 US$ missing is for the lender of your mortgage."
Do you believe that? Stuff like this is hard to believe but these are likely the facts as they are found on the ground.
It only adds one more dimension of the terrible mess Alan Greenspan and his Federal Reserve have made of this all, you can walk away...

That US financial system is nothing more like fire wood, ha ha one more 'world leader' going into the fire pit...
Update 08 Feb 2008: Why USA Dubya's economic stimulus plan will fail one 100% sure.
Weirdo George Dubya Bush has crafted a smart economic stimulus plan and every adult gets something like 800 $ and because 'no child is left behind' the kids get 300 bucks. Voting in their parliament has been done and just like Dubya is a stupid guy the American parliament is not much better; only single digit folks who were against this stupid plan that only raises the debt levels.
The size of this throwing money around is like 150 billion so this is a joke and a farce.
This is peanuts, just peanuts because I only have to repeat the next picture from Standard & Poors chief economist David Wyss around US citizens taking money from their house value:
Don't forget: This weirdo stimulus plan also goes to those who do not need it while tapping money from your house value is something you only do when you really need it. Just look at the numbers: 2006 = 650 billion, 2007 = 500 billion and so what is this stupid 150+ billion going to do anyway?
And how come there is no US senator or representative that speaks truth to power? If all that home tapped money does not work, why should this plan work? It will be a 100% failure and the Democrats have voted in favor of it too...
Conclusion: Both the Senate and the US Congress know about the reality in that debt driven country but they still do not dare to tell the simple minded truth. So they are not of much value and if the government is not of much value likely the rest of that society has the same kind of branding.
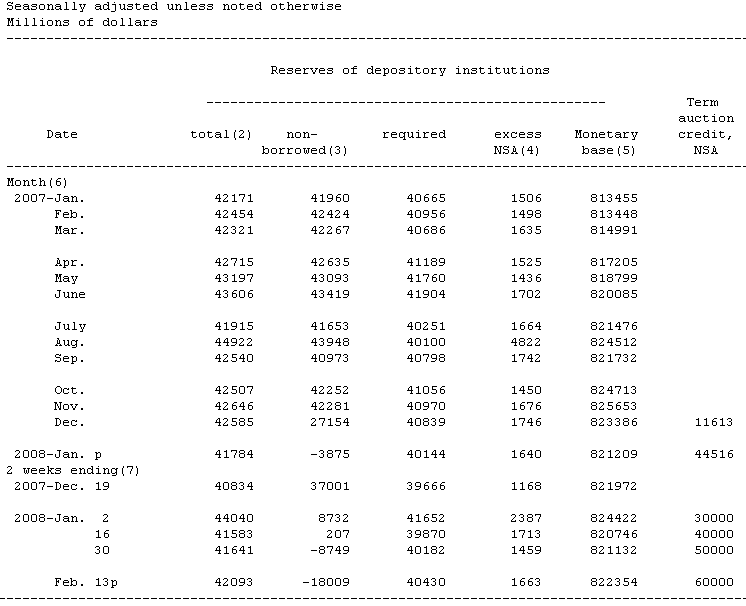
Update 14 Feb 2008: The fairy tale of smart money auctions versus protecting the money base.
Sometimes in financial news files you read that those new money auctions are so clever because they prop up the reserves of the commercial banks while at the same time the commercial banks are provided with liquidity so they can keep on lending money out to those who need it.
On the other hand you expect central banks to rule and regulate the commercial banks and when a commercial bank has no reserves left, it is logical that this bank will go for bankruptcy. This is what the public wants so central banks should be feared by the commercial banks because without the fear they would start doing weird things.
In the picture (table) below you can find the real reserves of the 'depository institutions' (mostly commercial banks) in the column 'non borrowed (3)' and as you can see: combined reserves stood at minus 18009 million US dollar. So in fact there must be at least one US commercial bank in the red (very likely most of them are in the red but anyway).
Yesterday I emailed the International Monetary Fund with these small problems about combined US commercial bank reserves being in the red yes or no, it is now over 30 hours later and I still do not have a message of receiving my email...
Don't believe me? Well here is the text of the email I did send to the IMF, quote is the email I did send to the World Bank (Amy answered within five minutes...):
Hello. I think you need to direct this question to the IMF.
Best, amy
----- Original Message -----
From: "Reinko Venema" [rvenema@home.nl]
Sent: 02/13/2008 12:22 AM CET
To: Amy Lynn Stilwell
Subject: Can you confirm that indeed the combined reserves
of US commercial banks are negative?
Unquote.
Furthermore I did some calculations I will not repeat around here, they indicate that at the moment of writing the combined reserves of US commercial banks dive deeper in the red at a speed of 2 billion a day (so the 800 million from the email is in fact not correct, it is double that stuff due to the money auctions effect on this all).
How will the Wallstreet traders react on this news? In the first place they don't understand it, in the second place they do not track news like that but only retail sales and stuff like that and in the third place they are busy with their latest toy: computer program trading...
Computer program trading beats everything, it can crush all human traders who only use their brain and the Wallstreet traders love it so much they simply neglect the detoriation of bank reserves. They can't care less...
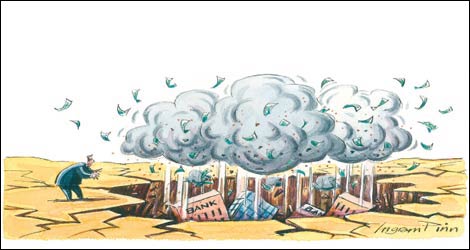
Update 22 Feb 2008: Combined US commercial bank reserves at minus 78008 million or more.
A few days ago I came across a relatively nice article in the British financial times, it had the title "America's economy risks the mother of all meltdowns". And since this is not only a risk but a future certaincy I did read it with some interest and indeed: the writer of the article did not take the stuff very serious. You can see that a bit at the picture that was placed by the article, it is still humorous the ft thinks:
Below is a link but I don't know how long it lasts because lots of files on the financial times work only for a day or five. Link:
http://blogs.ft.com/wolfforum/2008/02/americas-economy-risks-mother-of-all-meltdowns/
Since I now have a free subscribtion I can place comments in the so called blogosphere, here was my comment on the article (it is rather technical in nature but it proofs that likely this year we will have such a meltdown).
| My name is Reinko Venema and I am an academic in math and statistics and have tought for a number of years on higher economic schools. Since 2003/2004 I am following the economical evolution of the USA since the present times were foreseen in those years… I would like to bring to the attention two files from the Federal Reserve that nail down a lot of the in the article above mentioned lists. Detail 1 from the so called Z1 release, here is the link: http://www.federalreserve.gov/releases/z1/current/accessible/d3.htm This file is a collection of debt, not all debt is included since we all know that US Federal debt is far above 5057.9 billion as stated in the Z1 release. Go to the one last column for the debt of the entire US financial sector, the latest two quarterly numbers are: 2007 Q2 = 14855.0 2007 Q3 = 15435.3 billions of US$. Elementary calculus yields that the combined US financial sector ‘needs’ 2.5 trillion or 2500 trillion more debt in the year 2008. Of course no such amounts are available since we have: Detail 2 from the so called H3 release, in the H3 release the combined reserves of the US comercial banks are published. Here is the link: http://federalreserve.gov/releases/h3/Current/ In the column ‘non borrowed (3)’ you can find the real reserves and at the moment of writing they are about 18009 million US$ in the negative zone. As far as I know reality the FED uses Basel 1 to measure these reserves so the off balance items that are used in the money auctions are used to prop up the on balance sheets… Therefore the total negative US commercial bank reserves are as next: 18009 million + 60 billion auction money + the rest of the losses on the off balance items. I invite the economists to validate what I had to remark and underscribe my conclusion that detail 1 together with detail 2 will assure a tidal wave of bankruptcies in the US financial sector. |
To my surprise the next day the comment was removed (because I was curious if there would be any remarks made by real economists since I am only an amateur on that field). So I got instantly mad and placed a few comments like 'Since when is the ft the poodle of Wall Street' and in no time the comment was replaced again...
But I, as a person, am not very interesting. It is about the two details above that we very simply have: There is no 2500 billion around to finance the debt the total US financial sector needs, no we have a 'credit crunch' because the reserves to the combined US commercial banks are negative. You can argue about how much but they are negative and declining by the day.
This alone will bring back the DOW to the 7000 regions but there is also rigid evidence that the profit per share is declining fast and we could have a contraction of total corperate profits of something like over 20% and thus stock prices will follow... Right now we have DOW still above 12000, minus 20% is below 10000 and once the negative bank reserves hit the wires we will be in no time at 7000 or lower...
Update 04 March 2008: For the time being: US commercial banks saved by the bell.
Last week on Thursday the highly interesting US Federal Reserve H3 release was out and since finally this money auction stuff from the central banks had found interesting equilibrium (30 billion old $ in and 30 billion fresh auctioned stuff out) it was very interesting how total US commercial bank reserves would hold out...
Well total outstanding auctioned money stoods and stands at 60 billion and the total non borrowed reserves stood and stands at about minus 20 billion. So on the surface it looks like the FED is telling the 'truth' by stating that this is only elementary arithmetic because 'borrowed money' exceeds the 'non borrowed reserves' and therefore it is very logical that the 'non borrowed reserves' are in the negative.
This all is highly interesting: Whatever the US commercial banks had as reserves, they gave it away to the FED in exchange for US$ and on top of that they managed to go short on their own reserves...
I think it is time for a fairy tale;
_____
We are in the year 1345 and king Atsivistscheisse from some European country asks his treasurer Caprio del Ponti what is left in the royal treasury because the king wants to stimulate the economy with more nickel coins. Caprio del Ponti is sweating and he says: golden coins are 20 thousand negative but nickel coins are 2 million in the plus my king.
The king was very pleased and gave orders to give to every person in his realm exactly 100 nickel coins so his economy stimulus plan would set in and after that he could conquer the entire world because his country was the strongest economy on earth...
_____
Now we are back in reality in the year 2008 we know that king Atsivistscheisse even never made it to a footnote of history, his world domination stalled when his civilians found out he was the 'owner' of a negative 20 thousand golden coins.
And this is what brings us to the present day: The US economy has over 50 thousand billion of US$ debt on herself and how are they going to repair this little detail? If they do nothing, this debt will tear their economy apart in a horrible but uncontrolled way and if they act their economy is in shambles because they will need decades to pay of this debt.
Have you ever wondered why 30 to 35% of the US population is heavily overweight or obese? Look no further; they always had it cheap...
Lets leave this update alone with that, all idiots who still buy US government bonds are only investing in nickel bonds and if they want to do that let just give them the room to exchange gold coins for the nickel ones...
Update 10 March 2008: Now it's official: US non hidden debt above 50 trillion.
Last week the quarterly US Federal Reserve so called Z1 release was out, you can read the 120 to 130 pages thing but that is boring and contains a lot of non interesting information. Exiting reading is done with the total outstanding debt (of the US economy on herself).
In the table below I have used all figures since the FED went from yearly reporting to quarterly reporting:
|
Debt outstanding, billions of US$. Source |
|||
| Year & Quarter | Domestic nonfinancial sectors total | Domestic financial sectors | Total |
| 2001 Q1 | 18357.3 | 8481.8 | 26839.1 |
| 2007 Q4 | 31212.5 | 15750.6 | 46963.1 |
| Total growth | 12855.2 | 7268.8 | 20124 |
| Annual % growth | 7.9% | 9.2% | 8.3% |
Since the US Congress and Senate lately raised the allowed US government debt ceiling by a few trillion and the latest 'official' figure I have is 9.16 trillion in Federal debt and since the Z1 release only reports 5122.3 billion in Federal debt we see:
Total non hidden debt of the US economy on herself is above 50 trillion or above 50,000 billion US$.
That is about 3 to 4 times the
yearly gross domestic product and the year on year rise of 8.3% is always
a multiple of the GDP growth.
To put it simple: 8.3% of 50 trillion is 4150 billion or about 30% of the
GDP.
Conclusion: Every year the US economy eats 30% of the entire GDP as new debt if the past seven years count for 2008. On a long term historical basis (since the golden standard was left in 1973) the US economy has grown about 3.17% year on year. And now we are in a position that debt grows about nine times faster then the gross domestic product does.
Would you invest in such a macro economical disaster?
To end with a little smile:
The Federal Reserve chairman Ben S. Bernanke is also know as 'helicopter
Ben', he has that nickname because weirdo Wall Street traders think he
will always come to the rescue when needed (thus not fight inflation but
protect the wealth of the rich).
But the fact that debt now grows nine times the GDP
growth gives rise to a nice 'helicopter constellation':

Yeah Ben, shove this leverage: Debt growth in absolute numbers is nine times the GDP growth in absolute numbers...
Update 17 March 2008: Why the 20 bank rescue plan will not prevent the meltdown of the US financial system.
In just four days one of the large Wall Street investing banks Bear Stern Cos fell and a friendly colleague bank came to her rescue, the Federal Reserve had to give a guarantee of the 30 billion of left overs that is in BSC. This was quite some shock to the slimy US financial folks because (of course) they have not read my easy to understand analysis of the debt grow estimation of this year for the US financial sector. The Z1 release from the Federal Reserve indicates that the combined US financial sector needs something like 2200 to 2800 billion more debt this year.
Lets for reasons of simplicity say it is 2500 billion US$.
Since we now live in the days of the so called credit crunch it is easy to see this 2500 billion will not be reached by far, so how does the 2500 billion split up given this information? It will be more or less split up via three numbers A, B and C:
A: Companies that report
a lower profit, A is the amount it is lower due to the crunch.
B: Companies that report quarterly or even yearly losses, B is the amount
that it is lower.
C: Companies that go bankrupt due to the crunch.
D: The new debt that is actually given.
Of course A + B + C + D = 2500 billion US$.
Remark: Total damage done (for example) by the C category can be far larger than the missed new credit, it can very well be that a company that misses 500 million in new loans gives a damage of many billions.
Now we take a look at the rescue plan, it is for the 20 largest banks although it was not reported if investment banks are included. Quote from the Federal Reserve:
For immediate release
The Federal Reserve on Sunday announced two initiatives designed to bolster market liquidity and promote orderly market functioning. Liquid, well-functioning markets are essential for the promotion of economic growth.
First, the Federal Reserve Board voted unanimously to authorize the Federal Reserve Bank of New York to create a lending facility to improve the ability of primary dealers to provide financing to participants in securitization markets. This facility will be available for business on Monday, March 17. It will be in place for at least six months and may be extended as conditions warrant. Credit extended to primary dealers under this facility may be collateralized by a broad range of investment-grade debt securities. The interest rate charged on such credit will be the same as the primary credit rate, or discount rate, at the Federal Reserve Bank of New York.
Comment: From the Bear Sterns
example it is known that the FED needs to stand guard for 30 billion of
Bear 'assets' mostly related to mortgage stuff. It is looking at tea
leaves but lets say it costs the FED 15 billion in the long run.
Again it is looking at tea leaves but the Bear was a large bank so lets
say the 20 banks combined can give a damage of something in the 200 to 300
range...
All in all it is not much of a 'massive rescue' plan because the losses in
the private owned homes alone can be up to 10 trillion or just 10,000
billion.
Therefore in my view this will not change the course of events in a
significant way, the amount of money pledged by the FED is peanuts
compared to that what is needed to prevent a serious crash..
At last: I found the new logo that might be used for the Bear bank!
![]()
![]()
![]()
What do you think of the logo? I don't like it that much, I would make something that directly touches the deep soul of every US citizen. Something like "Taxes are evil and debt is good".
Update 09 April 2008 : Poking fun at Alan Greenspan part 0002.
Yes we do a bit of poking fun at the guy that had the helm of the US Federal Reserve for 18 years and it were a bit too much of those years.
For reasons not understood by me at the present day Alan Greenspan still thinks that 'financial bubbles' are 'utterly unavoidable' where any macro economist knows that higher rates give rise to smaller bubbles. But that is not the way the Greenspan brain works, just like the USA elects idiots like Dubya they place dumbheads like Alan Greenspan at the helm.
Lets start with a quote from the Wall Street Journal from the idiot named Alan, quote:
For much of his 18 years atop the world's most-influential economic institution, Mr. Greenspan was lionized for the economy's performance. Now, he notes, he's being second-guessed for it.
"I was praised for things I didn't do," Mr. Greenspan said during one of three interviews at his sun-drenched office in downtown Washington, D.C. "I am now being blamed for things that I didn't do."
Comment: Of course you are blamed for things that you did not do: For example expressing 'serious concern between the median house price and the median income for the USA as a whole'. Alan just never understood the stuff of what he was doing in his last ten years of his weird stuff.
Lets proceed with the fun that will definitely deteriorate the US military power, funny quote:
Mr. Greenspan says he doesn't regret a single decision. In his view, many critics are ignoring evidence in his favor and failing to assess the process by which he made decisions.
Comment: The most strikingly decision Alan made back in 2005 was withholding the publication of M3 money growth because 'the costs outweigh the benefits'. Just from this you see we are dealing with an idiot...

Lets leave it with that, the above picture is a bit of a hyperbole but elementary calculations indicate some more trillions are trillions in write downs.
The International Monetary Fund lately published a file that says we will see 600 billion on write downs on the global scale but these fuckheads even do not answer my simple to understand emails: It will be above 2 trillion.
Why a profession like the IMF is publishing such weird stuff is unknown to me.
Update 09 May 2008: And the Paulson clown said: The worst of the credit crisis is over by now.
Here is the quote from two days ago from thestreet dot com:
Treasury Secretary Henry Paulson said the "worst is likely to be behind us" in the lingering credit crunch in an interview published Wednesday in The Wall Street Journal.
Paulson said it would take several months more to sort out the full effects of the credit markets' disruptions that began last summer and further "bumps along the road" remain, the Journal said.
Comment: Many people confuse the 'credit crisis' with 'down writings related strictly to the sub prime mortgages' and since Paulson has been a CEO of some large USA bank he simply uses the confusion around that important detail. I too think that when you look at sub prime stuff only we are definitely beyond the half of the down writings, after all sub primes are only about 6% of mortgages outstanding. But I understand also a bit of the stuff to come. Let me name a few:
--Foreclosures of homes are up by a lot and together with the new unsold new homes this gives a large enough inventory to oil and grease further decline in home prices. My simple to understand calculations indicate we could have up to 10 trillion in home equity wiped away, my insight on the time frame is more uncertain but rather likely most will take place in 2008 and 2009.
--It is understood that the US
Federal Reserve has now 125 billion in collateral in the TAF auctions,
further there are some good estimations out there that say it is now only
worth 80% of that. (Other sources say it is 70% but I am a scientist and
only use conservative measures).
This implicates that the real reserves of the US commercial banks are far
below the regularly rules on this detail.
--The Bear Chase Morgan JP conglomerate has still derivative positions of up to six times the US gross domestic product on herself, so only a small disruption in the underlying assets will give rise to a breakdown of those derivate positions.
--Since the HELOC (home equity lines of credit) have dried up, it was expected that credit card consumer debt would grow. For the month of March it was 2 to 3 times as much as so called 'economists' expected. This gives rise to the expectation that indeed most US economists simply do not understand where they are and more importantly: those that do understand suddenly have no air time anymore.
--Right now the US economy has over 50 trillion of debt standing on herself, with an interest level of only 5% the interest obligations only are 2.5 trillion a year and that is about as much as the US government takes in as revenue.
Here below you see one of the Dubya clowns, this clown does not understand how much interest there has to be paid on the outstanding debt. Team Dubya has more clowns, one of the most strange clowns is that Rice female. When the Israelis turn the Gaza strip into the Warsaw ghetto light version the Rice clown truly has no problems with it.
Title:
And
the Paulson clown said: The worst of the credit crisis is over by now.
__________________________
Update 12 May 2008: The problem with the GDP reporting.
What is the GDP? It is the so
called Gross Domestic Product and it is the combined output of products
and services that an economy has.
The USA is always very proud of her GDP because it often growth faster
than in other nations, for example in my own country Holland we always
have lower GDP growth and we always have large trade surpluses. We also
have minimum wages that are double compared to the USA so we also do not
have all that white and black trailer trash doing two jobs at a time. But
our GDP does not grow that fast as in the USA.
How come?
That is because in the USA the GDP growth and the debt growth are bound together, most American economists don't think so but whatever line of credit you study the result is always the same:
Let it be on the consumer level, lets say credit cards, HELOC, car loans or mortgages; it always grows faster compared to the GDP.
Let it be US companies: Always more bonds needed to sell in order to pay for the maturing bonds.
Let it be parts of the US economy, for example the financial sector. The last decades the debt constantly grows a multiple of the GDP growth.
Whatever line of credit you study, it always growth faster than the GDP (This also explains the obesity problem in the USA, most body fat is borrowed money...)
Why do I bring this long known
wisdom up again? Because I found a beautiful comment against the article
of some fucking Jew named Ben Stein.
I do not know if the yahoo article is a permanent link but here
is the fucking Jew painting a rosy picture of why there will be no Great
Depressions anymore period!
Title:
And
the Ben Stein clown said: There will be no Great Depression...

But there are more fucking Jews observed, the next quote is from a fucking Jew named David and it proves David has brains! David did not agree with the rosy picture as painted by Ben Stein. Here is the quote:
Ben brings up GDP, that sacred number that all look to as the proof that the good times are still upon us. What he ignores is that GDP includes all the deficit spending of the government. The government is and has been growing the deficit fast then at any time in the history of the country. All that money gets spent on stuff; weapons, services, employees, you name it, which in turn comes around and is counted as part of the countries GDP. It's like running up the credit card but counting that money as part of your income.
Comment: David is very correct with his observation that in general the US GDP is counting debt as income. I am jealous on the next detail, quote:
It's like running up the credit card but counting that money as part of your income.
Why did I never thought of explaining the stuff that is going on in such a simple to understand way?????????????????????????
Even the main stream media can understand such simplicity, of course they won't tell it to the public because that is bad for advertisement income. But they can understand...
Update 15 May 2008: Some more proof that the IMF is loosing her sharpness.
In this financial world elephants can fly. In the real economy an elephant cannot get it's four feet from the ground at the same time because he is too massive. When you ask financial 'experts' as why elephants can fly over there they say stuff like 'Oh this is only some upward pressure on elephant prices and it brings in great profits. Why don't you put your savings in our Flying Elephant Funds?'
In this world the IMF means International Monetary
Fund. So you would expect some 'intellect power' at that agency.
My dear reader: the intellect just isn't there. I can proof it:
Lets proof it via some 'steps':
Step 1) Lately the IMF published that the housing prices in my own country were about 30% 'too high'. Very likely they have smoked some Dutch weed because the somewhat higher house prices in my country a anchored in law in a deep way. The IMF never got that simple detail right.
Step 2) When I email the IMF with some rather simple questions, I do not get any response whatsoever. Not even a confirmation of the email being received while the ECB simply answers me when I have a problem.
Step 3) When studying over or under pricing of house markets, a rough but reliable cannon is the relation between median income and median house price. If you study that one for the USA for the period 1996 to 2006 for the USA, any idiot can see US house prices will decline by 50%. The IMF never published a report stating that 'US house prices need to decline 50%'.
Step 4) The IMF never complained during the Alan Greenspan years that it was utterly dangerous to pump so much money into the system.
Step 5) Where was the IMF when the Federal Reserve stopped publishing the M3 money figures in 2005? Did they fire a warning shot? Did they say 'This is utterly not acceptable because how can we study the US economy without that figure!'?
And so on and so on, the list of IMF being stupid is a long long list.
Today the head of the IMF was in the news with the next (BBC source), quote:
The head of the International Monetary Fund
(IMF) says the worst of the global financial turmoil is over.
But Dominique Strauss-Kahn, the IMF's managing director, warned the effects of the turmoil on the broader economy would be felt for some time.
He added that a recovery in the US depended on house prices picking up.
Comment: Oh the idiot Strauss thinks he can talk up the US house prices? Does he really think he can kill my 10 to 12 trillion US$ baby?
Oh oh Strauss, you have a weird mindset. Let me quote on a bit more (source), quote:
Single-family home prices dropped 7.7% in the first quarter in the largest year-over-year decline since the National Association of Realtors began reporting prices in 1982.
The median sales price fell to $196,300, down 4.8% compared with the last three months of 2007.
Lawrence Yun, the chief economist of NAR, attributed much of the record decline to liquidity problems dragging down high-priced markets.
"These are highly unusual results because there were very few jumbo loan originations in the latest quarter," he said. "So sales are much slower in high-cost areas."
Comment: Nowhere in the Main Stream News nor in the blog sphere I have found that the 4.8% decline if family home prices is something like 1.1 trillion US$. Since 1.1 trillion is 1100 billion and the first quarter has something like 90 days, the daily decline in family home equity is only 12 billion a day. That is a negative equity swing for every US citizen of 40 US$ a day, and the Strauss Kahn idiot thinks he can prep that into a positive equity swing?
Title:
The
Strauss Kahn needs some lessons in elementary median statistics; the guy
is a fool.

My dear Wall Street traders, this is my present for
you today: Negative family housing swing of just 12 billion a day... I
know you can swing it up to higher DOW Jones values because you have all
those 'technical computer trade programs' but in the end the rest of this
weird weird world will also understand you have some 12 billion a day
swing problem into your housing market.
And what about the corporate housing stuff? Still prepped up with
elementary M3 money or is it prepped up with the profits from the food
markets?
Update 16 May 2008: And the Paulson clown said: US economy will rebound in the second half of this year.
Oh oh, the US economy needs 4 trillion new debt this year in order to stay 'normal' and aren't we in some 'credit crisis' or so? Therefore it was funny to observe that the US Secretary of the Treasury spoke words like 'The US economy will rebound in the second half of this year'.
Here is the quote (source):
WASHINGTON (AP) -- Treasury Secretary Henry Paulson said Friday that financial markets are "considerably calmer" now than they were two months ago. He predicted the economy will be rebounding by the second half of this
year. In a speech to business executives in Washington, Paulson said the drag from housing, which he characterized as still the biggest risk to the economy, will soon be lessened by nearly $100 billion in economic stimulus payments to U.S. households.
"The fiscal stimulus will provide support to the economy as we weather the housing correction, capital markets turmoil and higher energy and food prices," Paulson said in his prepared remarks.
The economy has been pushed to the brink of a recession by a prolonged housing slump, a credit crisis, soaring energy prices and more than a quarter-million job layoffs over the past four months.
In his remarks, Paulson never used the word recession, although many private economists believe the country is in one.
But he did forecast that the stimulus checks going to 130 million households would help spur growth in the second half of the year. He said that those checks along with business tax breaks in the $168 billion stimulus package would add 500,000 jobs by the end of the year over what would have been created without the stimulus boost.
Comment: In the update from yesterday we saw that
about 1.1 trillion of family housing value was wiped out in the first
quarter or about 12 billion a day. So this whole stimulus package of 168
billion US$ is vaporized in just two weeks... Just think about it, just
two weeks...
In the end of the quote you see that Paulson thinks that the 168 billion
package will create about 500 thousand jobs. That detail is correct; if
you create jobs this way it costs about 300 to 500 thousand for every job.
Hence every new job needs to bring in 300 to 500 thousand of taxes before
the US government only 'breaks even', that is a whole lot of taxes.
Title:
And
the Paulson clown said: In the second half of 2008 the economy will
rebound...
__________________________
Update 21 May 2008: Interview with Wall Street investor David McCoingrab.
Since, for reasons unknown to me, the main stream media never ask the right questions at the right people, why not construct a fake interview with a so called Wall Street investor?
His name is David McCoingrab, he is seasoned Wall Street investor and he works for RPP Investments:
Title:
David
is always booming...

Reinko: Welcome to the show David, I am glad you could make some time.
David: Thanks for having me, we at RPP like your show a lot.
Reinko: Well thank you! David what stands RPP for?
David: We at Rape Pillage and Plunder Investment identify weaknesses and strong spots for our clients, we kill all that is weak and invest in that what is strong. As usual we outperform the markets.
Reinko: That is very interesting, what is your view on the technology sector in the USA?
David: Technology is of course more a Nasdaq thing but technology more often than not outperforms the market. But you must be selective, identify the weak and strong companies.
Reinko: Now that is an interesting answer! Within the tech sector as a whole you have the defense technology. What is your take on that?
David: Now that we are fighting a war that we did not ask for, the defense sector always outperforms the techno sector. We always advice our clients to invest in defense so our brave men and women in uniform can kill those radicals with ease.
Reinko: So you guys at RPP like a few good killings?
David: Yeah man, you can bet on that. The more dead corpses the better!
Reinko: What's your view on the entire market, so on all sectors?
David: All sectors have more often than not, a tendency to outperform. This comes because our highly efficient markets always have all the bad news already priced in so there can only be surprises in the upswing.
Reinko: That is very interesting. Now I would like to ask you a bit around the problem of leverage.
David (interrupting): Oh the leverage problem is being worked on so that is almost solved by now.
Reinko (smiles politely): Now that is good news David, but lets take a look at the next picture. It says that the government sponsored entity Freddie Mac is leveraged as a whole over 50 times. So their total assets are over fifty times their total market cap.
David: I do not see the problem, when those assets climb only 2% than the wise investors have a full 100% profit. Here in the USA we constantly invent more financial instruments that bring more and more financial innovation. That is a crucial element of a thriving economy, like for example General Motors went into car loans and the auto mobile industry went booming.
Reinko: Yes, but if those assets from Freddie sink only 2% than all market cap is wiped out leaving Freddie Mac as bankrupt as investment bank Bear Stearns?
David: Oh no, there is a whole array of financial
instruments that will prevent such scenario's. You can protect the value
of the assets with derivatives and in the case of irrational market
behavior the management of Freddie Mac simply puts the value in the safe
on Level 3.
So you see: there is no problem at all.
Reinko: Hey man that is interesting! Can you tell a bit more about that?
David: Yes, when the management of Freddie Mac
observes that some market participants indulge in completely irrational
behavior, by law they can put it in the safe at Level 3. That leaves the
book value intact and they only have to wait until those weird market
participants come to their senses again. And when normal market conditions
are there again, it can be placed back.
Those Level 3 assets work just like the air bag in your car; it can save
your life.
And don't forget, what comes up must come down so later always those Level
3 assets are placed back and every thing is back to normal.
Reinko: But when you study the median family income compared to the median house price from the period 1996 to 2006, you arrive at the conclusion that about 50% of family housing value will fade away. What would happen in such a scenario?
David: Oh, very likely the house prices were very undervalued in 1996 and if not the entire universe easily fits ten times in the safes at Level 3. Level 3 is a highly advanced mechanism for protection just like the air bags in the car.
Reinko: That is amazing David, you folks are very smart! But I want to ask you a few things about food prices in the USA. There is some reliable information out there that says meat prices are not going up like the rest of the food prices. Do you know a bit more about that?
David: It might very well be that the margins of meat are not that good, so the American consumer can buy more things that bring in a higher margin for other companies. And when those companies have more profits than in no time you have the entire economy booming.
Reinko: That is a wise insight David. But irrational people point to the fact that US farmers cannot afford the high prices for animal food so they sell cattle to the slaughter houses. And thus the number of cattle is declining.
David: The glass is half full or it is half empty, the benefits of less cattle are huge: More land for bio fuels and less animal food needed so again more land for bio fuels. And bio fuels are big money and bring good profits therefore in no time the entire economy is booming and booming and booming. We at RPP always tell our clients to try and make a profit of the situation, whatever the situation is.
Reinko: Now who can beat so much insight. The last question is about the derivative positions around General Motors. Some say there are over one trillion of all kinds of derivates on GM. Don't you think that when the stock of GM falls too low that these one trillion positions come thundering down?
David: Even if they do come down there really is no
problem, look for example at hurricane Katrina. Everybody was shouting
that this would be bad for the economy of New Orleans because everything
was destroyed. But very soon we did see all kinds of positive effects. One
of those effects was the profits made by the graveyards and the
undertakers. Since the families with the dead ones were in such distress,
they could heavily be over charged. So the undertakers had money in their
pockets, they had money to spend.
Same goes for the home builders and the levee construction companies; once
they have money in their pockets in no time the local economy will be
booming and booming and booming.
Reinko: Ok David, I think I get it. Thanks for your insights, I always learn something from them!
David: Thanks for having me.
Title:
David
is always booming...
__________________________
Update 04 July 2008 : This is funny: The DOW Jones in Euro.
The goal of this file is of course to guide the DOW
down to 7000 points (or below that).
And although slowly, stock indices go down globally since I opened this
file.
In the picture below you see the value of the DOW in case it would be measured in Euro instead of the local US currency known as the US$.
Yet I want the 7000 in US$ and not Euro, of course
further devaluation of the US$ only takes it longer to reach that 7000
mark.
That is obvious.
(Source is from seekingalpha dot com and often the statistics from there are a bit shaky upon inspection, I haven't checked the graph below because I lack access to the proper time series to generate graphs like below. But my gut feeling says the graph is ok.)
Title:
This
is how the DOW Jones looks in Euro's.
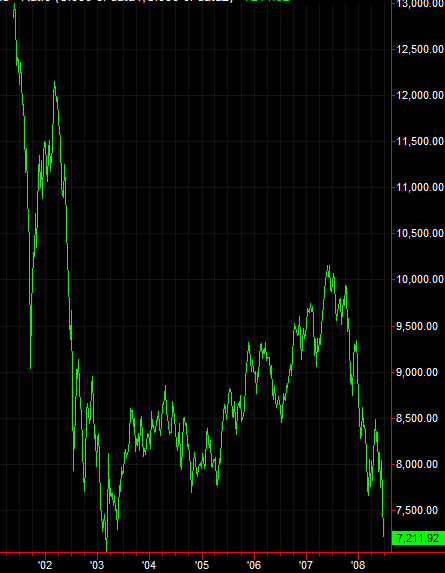
It would also be funny if you put the value of the DOW in oil or, vice versa, express European stock indices in US$.
There is more to suggest that we are at a 'technical tipping point'; if from the present level the US Standard & Poors 500 broad stock index declines about 20 to 40 points then in the first time in history we will have a decade loss on that broad S&P index. Of course I am 100% sure that main stream media CNBC will not report on that technical S&P detail but keep on pumping one hundred useless video's a day...
__________________________
Update 10 July 2008: Ratings agencies: It could be structured by cows and we would rate it
The US 'watchdog' the SEC has investigated the role of the ratings companies like Standard and Poors and the like, this in order to find any wrongdoing in all that far too rosy ratings they have done year in year out.
This investigation has lasted about 10 months, right now there are still thousands and thousands of products on the balances of the commercial banks that are rated far too high. And that are a whole lot of billions in non existing value.
Lets quote a bit (Bloomberg source):
``We uncovered serious shortcomings at these firms,'' SEC Chairman Christopher Cox said today at a news conference. ``When there were not enough staff to do the job right, the firms sometimes cut corners.''
But it gets more funny when:
``Let's hope we are all wealthy and retired by the time this house of cards falters,'' said the e-mail, which was sent Dec. 15, 2006, to another analyst at the same firm.
And what about structured investment vehicles structured by cows?
``One analyst expressed concern that her firm's model did not capture `half' of the deal's risk, but that `it could be structured by cows and we would rate it,''' the SEC said.
Of course employees are always allowed to have some fun in order to deal with the daily workload, so the 'cow joke' can be forgiven but the guy stating he hoped to be wealthy and retired before this house of cards falters needs a kick in the ass.
In order to measure how much completely fake capital is still on the balances of the banks, we simply have no clue whatsoever observed. All I know is that the 'off balance items' (the shadow bank system) is of similar size compared to the 'on balance items' so it is evident there is a whole lot of shit still out there waiting to get written down (or sometimes rated down by the rating agencies).
Oh oh those ratings agencies, please go to above and read how Standard and Poors chief economist David Wyss reacted when I asked him that I doubt the long term rating of the US government bonds (still AAA but what is the foundation of that rating?????). Scroll to above or take a short cut.
Title:
These
cows are structured by now, lets chop them into AAA rated securities...

I want to end this update with a problem I still do not understand, most of the credit crisis thing is understood by me but I have a serious problem with the total amount of outstanding mortgages in the USA. In short it goes like this:
From the US Federal Reserve to all media outlets,
when there is talk about the total amount of outstanding mortgages it is
always below 11 trillion. When you add the HELOC (= home equity line of
credit) you arrive at only 13 trillion.
That would mean that on the top of the US housing market half 2006 we only
had 60% of borrowed money in the US housing market leaving a healthy 40%
in public ownership.
So how come the foreclosure ratings are climbing this fast?
And given the fact we had negative savings ratio's of individuals and families for years on a row, is the reported 11 trillion realistic?
Just look at this US Federal Reserve source file, it says:
Mortgages = 10610.6 billions of US$, but it also says about the Federal deficit that it is:
Federal deficit = 5244.5 billions of US$.
We all know about the Federal deficit stuff: It is between 9 and 10 trillion while the wars in Iraq and Afghanistan are on emergency spending so those costs are outside the 9 to 10 trillion estimate. And we are supposed to believe the 11 trillion in US housing mortgages are just as reliable as that?
It's a deep mystery, but I never found any kind of clue that points to far higher mortgage totals (they must be higher says my gut feeling looking at all the other statistics) but where do I need to look & search?
__________________________
Update 14 July 2008 Has the big squeeze finally set in?
Via the Russ Winter blog I found a nice picture that
I have been waiting for a long time, it is the total debt of the US
commercial banks.
It looks like the credit crisis is finally setting in; most people think
that the crisis part only refers to less availability of debt but in fact
the level of debt are so huge that they need to decline. And the decline
is like an obese human set on a strict diet.
We cannot say for sure but it looks like the big squeeze is finally there.
But when I checked the source, it might very well be the big squeeze is avoided for the time being:
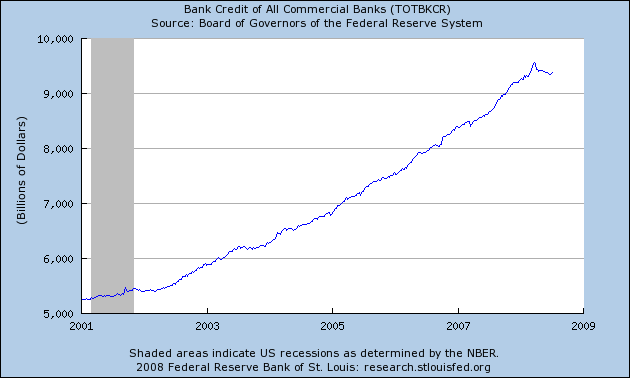
So lets wait and see how this one will develop, in case you are interested in these kind of very boring graphics here is the Saint Louis collection of that stuff.
You see the commercial banks have a total debt of lets say 9400 billion and given the latest Z1 release from the Federal Reserve total debt of the entire US financial sector is now 15945.7 billion so the rest of the financial sector has a rough 7 trillion on her shoulders. (Source, look in the one before last column; Domestic financial sectors.)
Needless to say that the US financial sectors has over one US gross domestic product of debt on herself, how they are going to pay for that (let alone the interest!) is a miracle.
Lately there was one of those CNBC journalists on the television comparing the government debts of some industrialized nations, with amazing the idiot stated that Japan had over one gross domestic product as government debt. It was about 160% percent of the Japanese GDP and so the idiot from CNBC had the next insight:
That's why the Japanese Central Bank keeps the rates so low!
Oh oh, you will never hear that total debt in the USA is over 400% of the US GDP; the folks from the CNBC channel always dance away from the real economy and we are only allowed to view the brain children of bank people (we see a rebound later this year, when later this year the European economy goes into recession we see room for lower rates, bla bla this and bla bla that).
__________________________
At last I would like to tell you folks a bit more about what 'setting interest rates' by Central Banks actually is; when the US Federal Reserve sets the (lowest) rates at 2% this is not some kind of law that every one bows for. They need to defend that rate with pumping more or less money into the system. And so this rate actually fluctuates a bit, here is a pic with the idea:
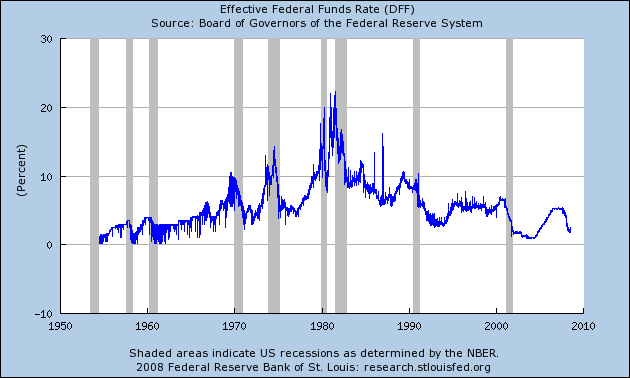
And when you zoom in on the last five years it looks like this:
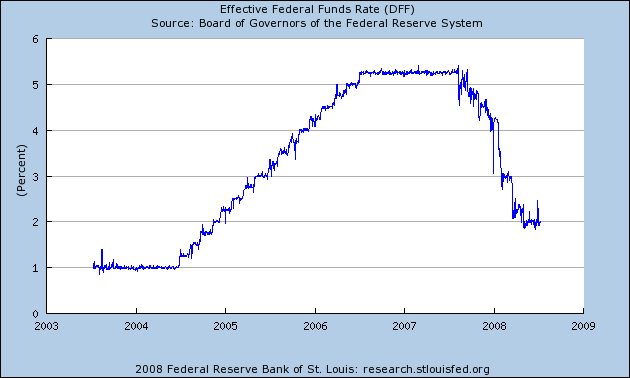
Do you see the spike at the end? The effective Federal Funds rate wanted to jump almost 50 basis points! So the US Federal Reserve needed to pump a lot of money into the system and now scroll back to above the second picture of this update: That is where the new debt from the US commercial banks is coming from...
I know this all does not have much to do with the NightmareOnWallStreet in a direct sense, but you have to understand the fundamentals and that's why I publish all this boring kind of stuff. Yeah yeah my dear reader, you don't fool me: You must be very bored by now...;)
At last a detail that I only know for a few weeks:
In the past before we had the Euro the German Central
Bank did not set rates but money growth!
So they did not set an arbitrary rate but money growth at for example 4.5%
(year on year of course) and adjusted the interest rates while achieving
the money growth rate.
I think that is smart, it explains why the Deutsche Mark always was that strong and how on the back of that strong currency a strong and rigid economy could grow.
Lets leave it with that, till updates!
__________________________
Update 15 July 2008 : US St. Louis FED reports: Zero recessions in the last 40 years.
Today I just wanted to take a look at the development of the US gross domestic product over the last decades but to my amazement I can now proof the following statement:
According to the US Federal Reserve there have been zero recessions since we left the golden standard.
I will give the proof below, before we proceed I would like to explain what gross domestic product indices are. Lets go:
It is a product index, so not a price index. Inflation is a price index, the GDP is a product index.
Product and price indices come mostly in two different kinds:
1) The kind that uses as much information as possible
from the past. (Best for basic products.)
2) The kind that uses as much information as possible from the present.
(Best for luxury products.)
Here in Europe they are known as Laspeyres and Paasche indices, with the use of the geometric mean you can use these Laspeyres and Paasche indices to calculate so called Fischer indices that abides relatively simple mathematical rules.
Let me spare you the math formulas.
Since the GDP is a product index it tries to measure the differences in product and service growth, often it is mentioned that the official definition for an economical recession is the next:
A recession is two quarters of negative GDP growth.
You can argue long and short on the wisdom of this definition; the ruling powers in the USA use this definition so why should I not use it?
In the next US FED St. Louis picture you see all stuff from world war II until now:
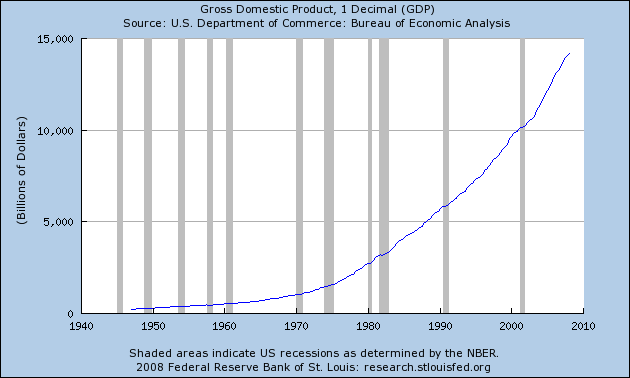
As you see on an informal inspection, the US GDP
never declines. Even in the shaded regions it never goes down.
Furthermore you see that the gray shaded areas represent US recessions as
determined by the NBER, the NBER uses not the official 'two quarter
decline' as a measurement because the reported GDP is far to volatile.
They use broader ways of determining economical contractions.
It is funny to observe the present chairman of the US Federal Reserve Ben Bernanke was on the board of the NBER when they declared their latest 'recession'. Here is the link:
http://www.nber.org/cycles/november2001/
But the Federal Reserve bank from Saint Loius gives you the possibility to zoom in on the graph, so I zoomed in on all six recessions we had in the USA since 1970. Here we go, we start with 1970 to present 2008. Again you never see the GDP decline:
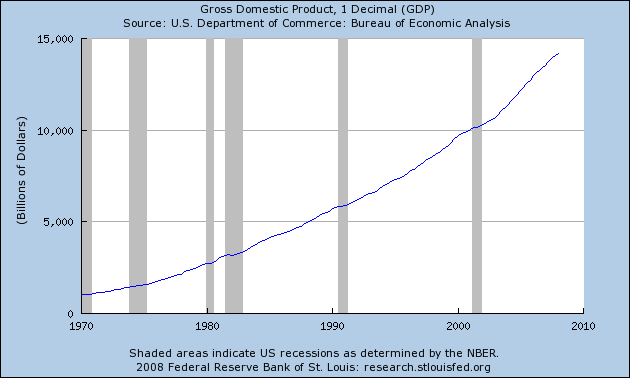
Zooming in on 1970 to 1971:
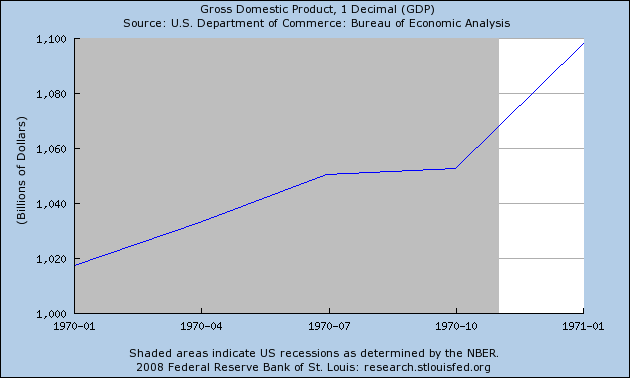
Zooming in on 1973 to 1976:
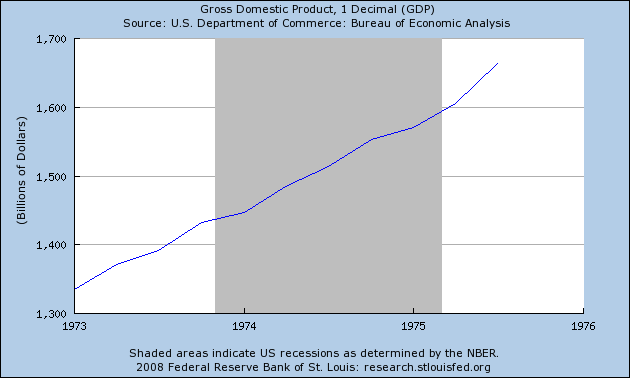
Zooming in on 1979 to 1981:
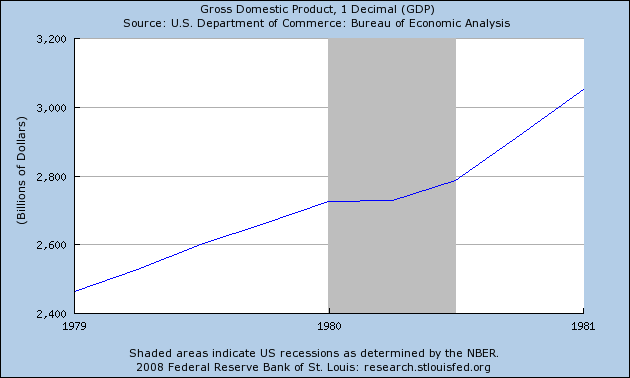
Zooming in on 1981 to 1983:
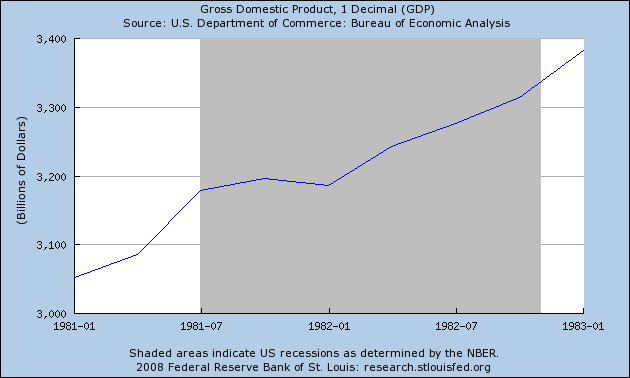
Zooming in on 1990 to 1992:
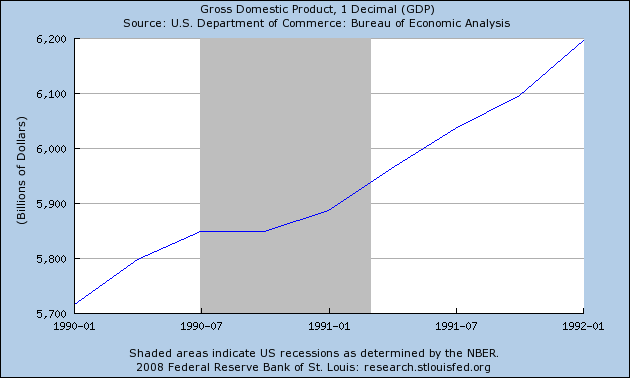
And the last 'recession' from 2001 to 2002:
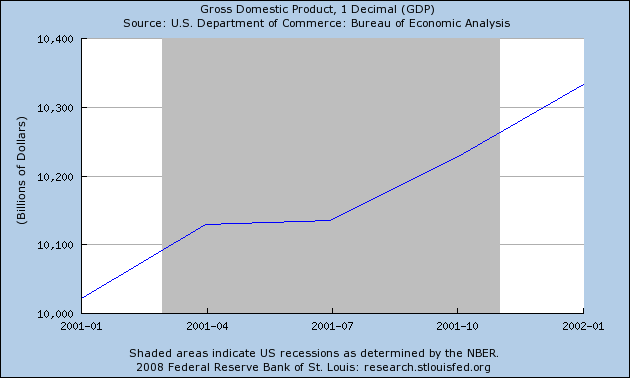
Did you on any kind of time scale observe just one decline in the US gross domestic product? Isn't it strange that never ever the US gross domestic product declines over just a few months? You can argue that the reported GDP value is just some moving average but the US St. Louis FED never goes into detail on this; why should you use moving averages in the first place?
Why not report the stuff as it is actually found?
Today it came to light that US Federal Reserve
chairman Bernanke estimates present GDP growth as between 1.0 and 1.6%,
but how do they estimate stuff like that? When even second hand car prices
are declining how can the US GDP still grow?
The answer to that is just one of the mysteries of US Federal
statistics...
Title:
My
name is Ben, you can trust me...
__________________________
14Sept2008: US Federal bank insurance corporation has in fact zero funds.
Here in the Netherlands where I live, the Central Bank guarantees the deposits of bank customers in case of a bank default. So when your bank goes broke you get your money back until a certain threshold. (If you have more savings than this threshold you simply need to open more accounts in order to protect your entire savings.)
In the USA this is done by the FDIC, that is the Federal Deposit Insurance Corporation. In the USA accounts are insured until 100.000 US$. Since finally more banks go broke, the FDIC is more and more in the news lately. And in that news constantly a fund is mentioned where 40+ billion US$ are in so that banks can get saved when needed.
To my surprise this FDIC fund is just like those Social Security and Medicare funds: The money is already spend on other things and only weird stuff like US Treasury bills are put in place. These funds even receive interest from the US government: more bonds...
Via this link I found the next funny text from a long time ago when there was only 11 billion in the FDIC fund (source), quote:
When I became Chairman
of the FDIC in 1981, the FDIC's financial statement showed a
balance at the U.S. Treasury of some $11 billion. I decided it would be a
real treat to see all of
that money, so I placed a call to Treasury Secretary Don Regan:
Isaac: Don, I'd like to come over to look at the money.
Regan: What money?
Isaac: You know . . . the $11 billion the FDIC has in the vault at Treasury.
Regan: Uh, well you see Bill, ah, that's a bit of a problem.
Isaac: I know you're busy. I don't need to do it right away.
Regan: Well . . . it's not a question of timing . . . I don't know quite how to put this,
but we don't have the money.
Isaac: Right . . . ha ha.
Regan: No, really. The banks have been paying money to the FDIC, the FDIC has
been turning the money over to the Treasury, and the Treasury has been
spending it on missiles, school lunches, water projects, and the like. The money's gone.
Isaac: But it says right here on this financial statement that we have over $11 billion
at the Treasury.
Regan: In a sense, you do. You see, we owe that money to the FDIC, and we pay
interest on it.
Isaac: I know this might sound pretty far-fetched, but what would happen if we
should need a few billion to handle a bank failure?
Regan: That's easy – we'd go right out and borrow it. You'd have the money in no
time . . . same day service most days.
Isaac: Let me see if I've got this straight. The money the banks thought they were
storing up for the past half century – sort of saving it for a rainy day – is gone.
If a storm begins brewing and we need the money, Treasury will have to
borrow it. Is that about it?
Regan: Yep.
Isaac: Just one more thing, while I've got you. Why do we bother pretending there's
a fund?
Regan: I'm sorry, Bill, but the President's on the other line. I'll have to get back to
you on that.
Comment: Well the text from above is from 1981 and it was indeed a very smart move to make. Even in 2008 the Central Banks from China and India are unaware of the large chunks of hidden debt there is inside the US Federal government. Because if they did they would not have bought all those Treasury bonds. And if they did the insurance on US Treasuries would not be that low like 18 basis points a year (that means it costs only 1.80 US$ to insure the value of 1000 US$ government bonds).
All in all this is peanuts; the fake FDIC fund is
only 40+ billion while in the Social Security and Medicare stuff runs into
the trillions of hidden debt. As why Central Banks from China or India
neglect this dangerous stuff is unknown to me, there are also hundreds of
pension funds that think that US Treasuries are the safest investments on
earth. That these represent the core of the core of that what is AAA
rated.
In fact it's a fairy tale and if you as an owner of US government bonds
does not buy insurance or better sell that stuff then you must not
complain when you get a nice haircut on your super solid
investments...
16Sept2008: Google news search on 'nightmare wall street' = 478 news articles.
So about 10 months ago I started the second activation of the Nightmare on Wall Street, I know it is cherry picking on the news but I did the google news thing on 'nightmare wall street' and the return was about 478 news files (I use the US version of google news that tracks about 4500 news sources). Here is a screenshot:
This is not bad after my humble opinion, if investment bank Bear Stern Cos has not been bailed out we would have this kind of fun much faster. There are lots of other reasons why it all goes so slow slow slow, but if that is the way it goes I am fine by that.
I want to use this update to remind you at a very old economical law that is hefty neglected by the Americans:
When you have far too much money in your economy, this money will destroy and hurt the economy until this excess of money has destroyed himself.
Most people think that too much money supply only gives more inflation, this is still true but in the present economical environment with electronic trading and hedge funds it is far more wider. Let me give you an example that is completely weird from my own country:
Here in the Netherlands we are heavy into the chip
industry, we have companies that make machines that make chips & these
are sold worldwide. Lately Philips sold a daughter company that produced
chips (so not the machines that make chips) to so called 'durf
capitalisten' (hedge fund cowboys).
The hedge fund cowboys borrowed the money to buy this chip maker.
After that they parked the borrowed money on the balances of the chip
maker.
Now this chip maker is drowning in debt and they have to borrow money in
order to pay for the interest of the debt.
In short: What once was a healthy and sound factory that could survive all business cycles is now a classical Ponzi financial unit (they need to borrow more in order to pay for the interest).
This process of economical destruction paints rather good what is happening right now in the USA and Europe; the bubbles destroy a lot of what has real value and this will proceed until the bubbles have destroyed themselves. It is all relatively simple to understand, only the Wall Street boyz do not understand that or they are not willing to understand this.
17 Sept 2008: Here we have that idiot IMF director general Dominique Strauss-Kahn again.
On 15 May I also updated upon the strange economical insights of IMF director general Dominique Strauss Kahn. In that update I explained that at the International Monetary Fund they simply have no insight in the century old economical rules for house prices. Simply said: Median house prices should be some fixed multiple of median yearly income.
Now four months later, Dominique is still a fool:
Title:
The
Strauss Kahn needs some lessons in elementary median statistics; the guy
is a fool.
Let me quote you the entire article (source):
JEDDAH (Reuters) - The worst of the financial crisis may still lie ahead and more major financial institutions may face trouble in coming months, IMF director general Dominique Strauss-Kahn said on Wednesday.
"The roots of the crisis are behind us, the roots being the fall in housing prices. The consequences for some financial institutions are still in front of us. We have to expect that there may be in the coming weeks and coming months other financial institutions with some problems," he said.
Still, the world economy was very resilient and should rebound in 2009, Strauss-Kahn said to reporters after a meeting with Gulf Arab finance ministers and central bank governors.
Comment: It is easy to proof once more that the IMF
director general is a fool beyond belief: The roots of the crisis are behind us, the roots being the fall in housing prices.
This is just so stupid, it is beyond belief. And this comes from the
IMF, that is an organization that is above the national level! If US Prez
Dubya or that Treasury clown Paulson would state such words, it would be
understandable.
But the IMF telling such distortion is simply beyond belief...
I have said it so often: Another 7 trillion in lost US family home equity
will be there before the housing correction is at its end.
22 Sept 2008 : The explosion of toxic debt.
What is toxic debt? That is debt that will not be paid back (or not fully paid back). The US commercial banks have lots of toxic debt as assets on their balances. With the downgoing of the US economy this toxic debt will grow and grow.
The US government right now believes in a fairy tale:
They think that if they buy toxic debt in the order of 700 billion US$
that the problems are solved. This is not the first time we observe rather
strange economical theories from the White House; we had those tax cuts
that would miraculous let the economy grow so that in the future there
would actually be more tax revenue.
We had the economical stimulus package where more borrowed money would
revive the economy.
Non of these fairy tales have worked and the 700 billion bailout will also
not work.
To understand why toxic debt will grow much more we take into account:
The size of the US financial sector is about 20% of
the US economy.
That is about 2800 billion of the US gross domestic product (about 14
trillion a year).
If the after tax profits are in the range of 10%, there is something like
280 billion a year in profits.
Now take a look at the next picture with a table of the total debt of the entire US financial sector:
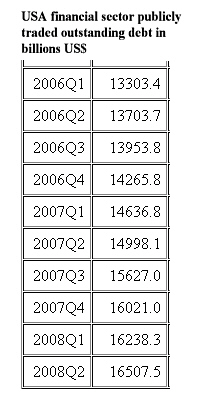
You see: This debt level is far above the US GDP and
there is only extra room to pay this off in the order of 300 to 400billion
US$ a year (I don't know exactly how 280 billion after tax relates to
'before tax' money).
So if all profits of the entire sector are used to pay off this debt, it
can only pay for about 2% of that debt every year.
In practice the interest is higher so this total debt can only climb
higher and higher and higher. Therefore a lot of the 16500 billion debt is
toxic, only most people don't know that yet. Just like when all those
mortgages were handed out; nobody knew they would grow toxic.
Plans are to suck up toxic debt over a period of two years, so lets calculate to 2010 Q2, I will make 3 scenario's:
Scenario 1) The financial sector debt will grow just
like the last 8 years: 9.3% a year.
Scenario 2) The financial sector debt will grow at the highest speed
during the credit crisis: 16.8% a year. (Source)
Scenario 3) The financial sector debt will grow at the lowest speed during
the credit crisis: 5.4 % a year.
| Future debt grow of the US financial sector. | ||
| Year and Quarter | % grow a year | Debt level in billion US$ |
| 2008 Q2 | 16507.5 | |
| 2009 Q2 | 9.3 | 18040 |
| 2010 Q2 | 9.3 | 19720 |
| 2009 Q2 | 16.8 | 19280 |
| 2010 Q2 | 16.8 | 22520 |
| 2009 Q2 | 5.4 | 17400 |
| 2010 Q2 | 5.4 | 18.340 |
Conclusion: Even in the most rosy scenario, toxic debt in the US financial sector only will grow about 900 billion a year.

10 Oct 2008 Derivatives for dummies, updated 11 Oct with the Value at Risk model.
This was originally posted on the home page to this website, given the extreme climbing's in the volatility indices (the fear index) I would like to repost this in these NightmareOnWallStreet files.
So I only 'cut and paste' from the homepage, after that I place a link to the online wikipedia encyclopedia and a graph from that link.
Here is the 'cut and paste thing':
(08 Oct 2008) Today it was a boring day on the financial markets, after my humble opinion the declines simply do not go fast enough while on the other hand I understand there is a lot of so called 'emotional resistance' in the brains of the diverse folks.Therefore, after waiting so long, I decided today to attack the so called 'derivative positions' that are traded by folks who do not understand their stuff.
Since I am a teacher I split the stuff in only two items:
Item 1) Derivatives for dummies.
Item 2) Derivatives for smart guys like the Princeton
dummies.
Item 1) Derivatives for dummies.
In the next video there is a wise lesson for dummies; the one trillion number mentioned is not needed at all. All banks that did this are vulnerable; they only got a phone call in the morning from a client with the specified risk and return needed and sliced some millions off stuff needed & sold that to the client.
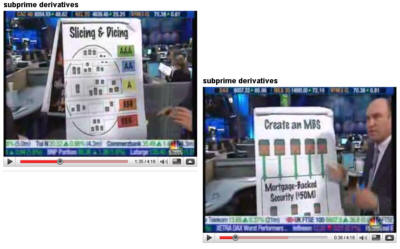
Item 2) Derivatives for smart guys like the Princeton dummies.
To the Princeton smarties now we have over 600 trillion in contract obligations on weird over the counter stuff I can say: The USA has some fundamental flaws in the pricing of derivates.
The flaw is very easy to understand, the USA traders think that their scientists have protected them because they are 'so smart'. In practice the option sellers should have used 'empirical info' that far more accurately describes the so called 'striking price'.
In order for the Princeton dummies to understand this, click on the next pic and sing the 52.05 minute vid out.
Wanna bet you don't understand all the details???
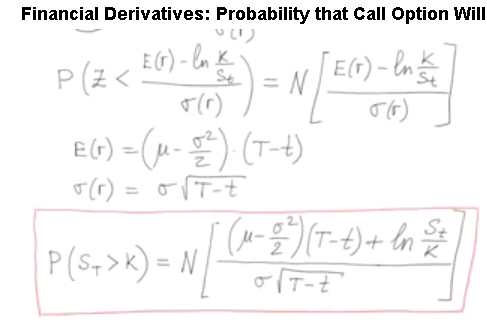
My main point of criticism is you must need the empirical distribution of the company in study and not use some stupid plus or minus 1% 'what is the difference' kind of attitude. The dangers in the 600+ trillion US$ derivative joke (with contracting value of about one US GDP) are in the tails of the distribution; the tails are likely far fatter then the standard theory tells us.
Till updates.
So far the 'cut and paste' thing.
On online encyclopedia wikipedia you can find a bit more on the VIX thing that was in the news today, VIX is some volatility estimation for the next 30 days on example the Standard & Poors 500 (the S&P 500 is a broad measurement of the US stock market). Stuff like this is the 'sigma' from the picture above.
Link: http://en.wikipedia.org/wiki/VIX
Here is the picture from that source:
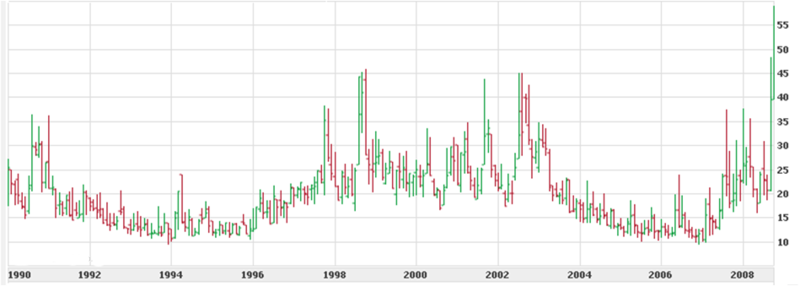
With that my dear readers fall apart in more or less three categories:
Cat 1) Bloody good job Reinko; just two days later
all hell breaks loose on VIX & other option market stuff.
Cat 2) Given the name of this website 'kinkythirts' the author clearly has
some 'mental thing' and the VIX spike is merely a reflection of recent
market turmoil.
Cat 3) Where are the kinkytshirts?
Updated 11 Oct 2008 with the Value at Risk model.
To my amazement I found the next quote today, this was not for option pricing but risk management. It seems that Wall Street uses a so called VaR model (VaR = Value at Risk) and this model has the same fault as the option prices have. Quote:
Lurking behind the models, however, was a colossal conceptual error: the belief that risk is randomly distributed and that each event has no bearing on the next event in a sequence.
And:
The more enlightened among the value-at-risk practitioners understand that extreme events occur more frequently than their models predict. So they embellish their models with "fat tails" (upward bends on the wings of the bell curve) and model these tails on historical extremes such as the post-Sept. 11 market reaction.
Washington Post source link, also worth a visit is the Prudent Bear (home page) and their must read files.
Comment: The guy that wrote the Washinton
Post file can be trusted, his name is James G. Rickards and was general counsel of Long-Term Capital Management from 1994 to 1999.
So he could study the blow up of LTCM from close and after years
of thinking he could write an article like that.
I myself studied the stochastic equations that rule the option
pricing stuff but after a few weeks I lost interest because I did
not agree with the Black Scholes approach and had other ideas on
that detail.
Now many years later I find that even those VaR models have the
same kind of fault in it, it makes you wonder why the Nobel price
for economics go so often to the USA...
End of the update.
29 Oct 2008: For the first time in history: S&P down in a 10 year period.
This update in the Nightmare files is also item 4 in
the update from the front page of this website from yesterday.
Given the significance (never ever the S & P 500 has been down on a 10
year scale) it is logical to repost it here, so let me do some 'copy and
paste':
For the last item to be published I waited
until the US stock markets were closed.
I waited because it was clear that the obese not understanding
economics stock traders from the DOW, Nasdaq and S & P 500
were busy doing a thing called 'staging a rally'.
When you ask one of those dumb obese 'professional' stock traders how the economy is doing you will rather likely get an answer like 'We staged a rally today so the economy is doing fine'.
As a matter of fact a broad stock value measure like the Standard & Poors 500 is down on a decade long scale and this is the first time ever that this happened.
S&P rallied over 9% today, this on only
negative news...
It looks like the USA folks have some 'emotional issues' with the
declining stock values, oh oh those poor fatbags.
Of course news like that never makes it to the front pages of the main stream media, main stream always has a bias to concentrate on the positive side of the story (we must not talk ourselves into a recession). In the picture below you see that in fact the NightmareOnWallStreet rules and not these obese not understanding economy Wall Street stock traders. Click on the picture for a bigger version or check the yahoo source file.

Today I would also like to post the so called TOTBKCR = Total bank credit of the US commercial banks. This has not to be confused with the total outstanding debt of the entire US financial sector that is above 16.5 trillion US$ and above one US gross domestic product (Z1 source, look in the one before last column).
On 14 July I reported on this statistic before because when there is a so called 'credit crisis' you might expect total debt levels coming down. This is not the case; in the financial sector most debt only grows faster compared to the 'normal situation' when there was no 'crisis'.
You see there is good hope the total bank debt will
rise above 10 trillion in this year 2008.
Only one reason more that this present system is going to
crash...
Click on the pic for a source file, you can adjust the date range and I choose this year only (from 01 Jan till now).
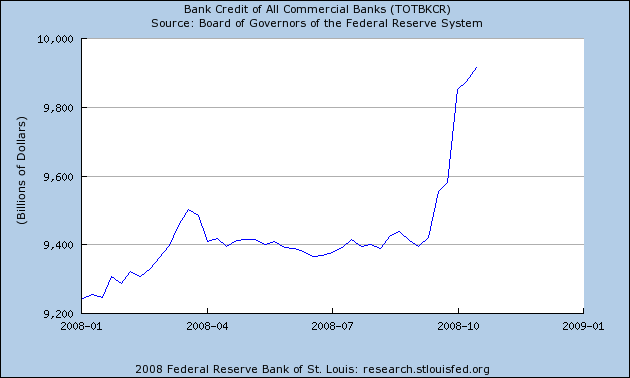
Right now the DOW Jones closed at about 9050 points,
yesterday it rallied about 900 points and as a matter of fact this is
good. The more volatility the better it is and for that we need large
upswings too. The larger the better for a prolonged period.
One small dip to my desired goal of 7000 and after that bounce back is not
very significant...
11 Nov 2008: US financial sector: Debt growth through the decades.
Let me keep the introduction so simple that all local teenagers can understand it and even some American or Princeton economists...
Here we go:
__________
In the womb a small sperm cell and a large egg cell
meet and decide to merge.
The merged cells close themselves off from all other sperm cells and
nestle down in the womb.
As soon as there is food and oxygen the cell starts to double and to
double and so on and so on.
That is a 100% growth every short time span.
After some time cells starts to specialize into the
rudimentary organs, the growth rate starts
to decline a bit.
Month in month out growth rates stay very high, every now and then there
is a small grow
spurt and about nine months after the merger of the now full grown baby
does an IPO.
After the IPO (the birth) there is usually a small
decline in growth for a week and after that
growth rates stay high but decline slowly.
When some years later the baby is a teenager we have the last growth spurt
until about a year
of 18 of age.
After reaching maturity there is no exponential
growth any longer but only additive growth;
on average here in Holland adults grow about 400 gram a year or about 4 kg
the decade.
__________
If someone keeps on growing exponentially in weight,
the person gets obese.
If in a mature economy that has a fiat money system (so there is always
plenty of money around
in order to promote economical growth) and debt levels always grow to
fast, there will be a so called
default because the debt levels have become too high and the interest
needed for the debt is above
the total of profits of that economy.
A lot of people only look at the so called government
debt as if a country could only default via
the government debt... You must look at all debt in the economical system
and also look at the
savings in the system. It could be debt levels are very high but if this
is compensated with enough
savings, there is no problem.
Yet when there is only debt and almost no savings, the system will
default.
The problems arise when debt levels always grow beyond the gross domestic product growth...
You only have to wait for it, but once the critical
debt threshold is taken in principle the economy
is doomed. It has reached 'Ponzi status', that means even for the interest
paid more debt is needed.
The government will respond with artificial low
interest rates, but they will find 'it does not help'
(because too low rates only bring more damage because people cannot save,
it is not that difficult
to understand).
In the table below I treat the reported Quarterly
figures as 'standing at the end' so for example
1974 Q4 stands at the end of Q4 so at 31 Dec 1974. As such the period
1974-2008 Q2 is 33.5
years long (it is just a detail).
Another remark of interest is the fact I used the
'inflation included' gross domestic product of
the USA, only since 1996 there are 'inflation free' figures around and may
be it is better to include
inflation because how do you measure it?
| US financial sector: Debt growth through the decades (since 1974). | |||||
| Year |
GDP |
Debt level in billions of US$ | Debt level as % of GDP | Period |
Year on year % growth of debt |
| 1974 Q4 | 1553.4 | 258.3 | 16.6% | 1974-2008 Q2 | 13.2% |
| 1980 Q4 | 2916.9 | 578.1 | 19.8% | 1974-1980 | 14.4% |
| 1990 Q4 | 5848.8 | 2613.6 | 44.7% | 1980-1990 | 16.3% |
| 2000 Q4 | 9953.6 | 8144.7 | 81.8% | 1990-2000 | 12.0% |
| 2008 Q2 | 14294.5 | 16507.5 | 115.5% | 2000-2008 | 9.9% |
Sources:
US
Department of commerce GDP growth.
US
Federal Reserve, accessible part of the Z1 release.
Remarks and observations:
1) During the periods when the Federal Reserve makes Quarterly updates of the Z1 release, the debt growth of the US financial sector is 9.3% year on year. Since this credit crisis started, this number it is on the rise again. So the consumers and businesses (the real economy) has less access to credit, for the banks it is the reverse.
2) Given the fact that the US financial sector now
has about 115% size of US GDP of debt on herself and given the fact that
the US financial sector is about one sixths of the entire US economy, the
so called 'local intensity' is about 700%.
That means: If the entire US economy would behave as her financial sector,
in no time they would have 7 GDP's of debt standing on herself.
3) The US economists in general and the Federal Reserve in particular simply do not have what it takes to manage a so called 'fiat money system', in the first place this is dumb, in the second place it is weird and in the third place it clearly proofs economy is not a rigid field of science like math.
4) We scientists know that political leaders are
often dumb people because they studied law on the academic level. That
only means they could not do a real academic study but because society has
an abundant need for 'academics' they function more or less properly
inside politics. So our political leaders know nothing from exponential
growth, it is a shame the same goes for the US economists...
Can anybody explain to me what US economical thinking has to do with
freedom???
30 Nov 2008: US financial sector: Prognoses of future debt growth for the next four years.
This is a repost of the first item from the homepage from 19 Nov, I hoped that this item would find some echo in the financial blogs & the financial news but this was not the case.
The importance of this item is only equal to the
large decline in US house prices (total of US house price decline could be
as big as 10 to 11 trillion in 2006 US$). Historically debt in the US
financial sector grew at 10% a year and that is over 3 times the growth
domestic product growth.
Since the US economists for reasons still not understood by me, do not
understand this debt growth will hit the 'tilt' (to say it in pinball
terms) I think it is wise to repost item one into this long page.
To understand why this item is so important; the US economists do not understand there is a critical threshold level of debt and after that stuff will collapse. The US Federal Reserve can monetize what they want (monetizing = printing money) but that won't help, as a matter of fact it is only one of the stages before the collapse...
Lets do the 'copy & paste' thing from 19 Nov:
Item 1) US financial sector: Projections of future debt growth.
Before we calculate the future projections I would like to go back in time to the day when in this credit crisis that broke out in the Summer of 2007, the first Quarterly debt figures of the total US financial sector came out in the Autumn.
The same day the debt figures came out, I understood the US financial sector needed about 2500 billion in new debt in order to do 'business as usual'. Of course, since this was supposed to be a credit crisis, the new debt would not be there and hence there would be a tidal wave of bankruptcies...
You can find these in the D3 sub-release of the Z1 release of the US Federal Reserve, let me 'cut and paste' it in a table:
| D.3 Debt Outstanding USA Domestic Financial Sectors (source) | ||
| Year & Quarter | Credit crisis? | Debt in billions US$ |
| 2007 Q2 | No | 14998.1 |
| 2007 Q3 | Yes | 15627.0 |
| 2007 Q4 | Yes | 16021.0 |
| 2008 Q1 | Yes | 16238.3 |
| 2008 Q2 | Yes | 16507.5 |
| 2008 Q3* | Yes | 17500 |
| * Based on media reporting. | ||
For me, as a scientist, it will be exiting to observe on 11 Dec (when the new Z1 release will be out) how good or bad my 2500 billion estimation of new debt was.
So far the past, lets explore some future
developments of this mountain of debt.
Since this is the 'Obama update' we calculate 4 years into the
future.
In that we use 16507.5 billion US$ at the
starting point and calculate three scenario's:
Scenario 1) The historical debt growth (since 1975, about 13%),
Scenario 2) The 9.3% YoY growth since the FED gives Quarterly Z1
releases &
Scenario 3) Use only data since the credit crisis started (that's
10.1% YoY).
Here we go:
| Title: Obama
fun scenario's for his presidency, inflation included*, all in billions of US$** |
|||
| Year | Historical | Q releases Z1 | Credit crisis |
| 2008 Q2 | 16507.5 | 16507.5 | 16507.5 |
| 2009 Q2 | 18653.5 | 18042.7 | 18174.8 |
| 2010 Q2 | 21078.4 | 19720.7 | 20010.4 |
| 2011 Q2 | 23818.6 | 21554.7 | 22031.5 |
| 2012 Q2 | 26915.0 | 23559.3 | 24256.6 |
| * At this
point in time it is unknown if deflation will set in, it is likely but there is no proof whatsoever. ** All in 31 July 2008 dollars or course... |
|||
One thing is clear: The credit crisis only lives in the real economy, in the imaginary economy (the financial world) it is the opposite.
So Barack Obama, this is my gift for you: I have done the calculations that your so called 'economical experts' will never give you. Bad luck for you; you will never read it, your 'economical experts' will prevent that...
At the end of Item 1), in case if you are
interested if the US Federal Reserve is interested in the
development of the total debt of the USA financial sector?
Today the latest minutes came out, you only observe a bunch of
people loose themselves in small details and nicely ignoring the
big stuff, link:
http://www.federalreserve.gov/newsevents/press/monetary/fomcminutes20081029.pdf
13 Nov 2008: But is it fraud at the US FED level?
Fraud is, just like pornography, hard to define; when you see it you know it but it is hard to define.
Only because I was following this statistic of 'Total debt on the US financial sector' I remarked that the US Federal Reserve is 'transporting' present debt to the past. For the time being it looks like about 133 billion of present debt is transported to the past.
In case you disagree with me; can you give another logical reason as why 2007 Q2 should be upgraded?
I have no information from before 2007 Q2, I simply trusted the US Federal Reserve not to behave in fraudulent schemes...
The stuff is very simple to understand: In the next table you see in the third column total financial debt as reported on Sept 18 and in the fourth column you see the same but now for the date Dec 11.
You know, as a scientist I hate it to write down
words like 'fraud' when it comes to the world reserve currency.
I am very sorry but transporting debt to the past to make files like
this a bit better simply is fraud...
Or may be a better word is 'official statistics' instead of that nasty word 'fraud':
| D.3 Debt Outstanding USA Domestic Financial Sectors (source Dec 11) | ||||
| Year & Quarter | Credit crisis? | Debt in
billions US$ Sept 18 |
Debt in
billions US$ Dec 11 |
Unexplained
difference in billions of US$ |
| 2007 Q2 | No | 14998.1 | 15132.4 | 134.3 |
| 2007 Q3 | Yes | 15627.0 | 15760.4 | 133.4 |
| 2007 Q4 | Yes | 16021.0 | 16154.8 | 133.8 |
| 2008 Q1 | Yes | 16238.3 | 16371.4 | 133.1 |
| 2008 Q2 | Yes | 16507.5 | 16604.1 | 96.6 |
| 2008 Q3* | Yes | 17500* | 16903.4 | |
| * Based on media reporting. | ||||
Lets leave it with that...
Update from 13 Dec on this 'transporting debt to the past' detail:
Yesterday when I found the US FED is doing weird stuff in her descriptive statistics I did not understand what was going on.
All we know these tables are seasonally adjusted and there are two basic seasonal adjustments: the linear and the exponential way, they are also known as additive and multiplicative models. If you give me any kind of seasonal trend curve that is not in that realm, I can explain to you how to adjust your seasonal figures. It doesn't matter if we are talking Spring to Winter, Q1 to Q4, the months or weeks of the year or the hours of the day.
Theses are well known models from elementary economics.
What is happening in the tables of the Federal
Reserve Z1 release had nothing to do with seasonal adjustment, below are
the four source files and after that two pictures with details from the
source files.
As usual I will concentrate on the total debt outstanding on the US
financial sector.
Sources:
http://www.federalreserve.gov/releases/z1/20080306/z1r-2.pdf (The March 06 2008 Z1 release debt tables.)
http://www.federalreserve.gov/releases/z1/20080605/z1r-2.pdf (June 05 2008)
http://www.federalreserve.gov/releases/z1/20080918/z1r-2.pdf (Sept 18 2008)
http://www.federalreserve.gov/releases/z1/Current/z1r-2.pdf (Dec 11 2008)
As a starter observation you can see that in
the first line total debt changed from 9355.1 billion to 9355.6.
This is weird; why now on 11 Dec 2008 report a 500 million change
in debt from over six years ago?
This has nothing to do with seasonal adjustment...
As a second observation, the 'unexplained
differences' from the table above (the 133 billion US$) stops at
2007 Q1 (where the 'old' debt of 14636.8 billion was changed in
the 'new' debt of 14763.4 billion).
As a third observation; yesterday I said that
this polishes the feathers of percentage growth of the debt.
This is correct, look at the 2008 Q2 line where annual debt growth
is downgraded from 6.6% to 5.7%.
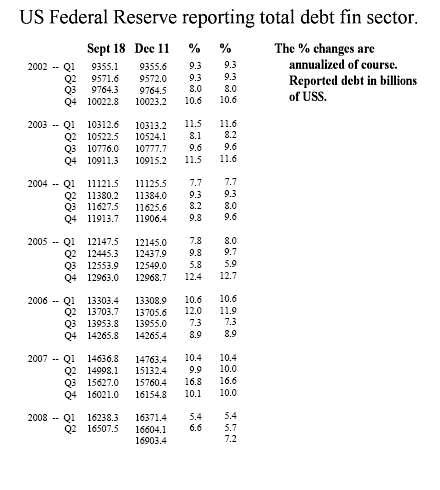
When you include more reports from the past it gets even wilder;
For example look at the 2007 Q4 line,
originally it was reported a 15750.6 billion of debt on
March 06 2008, at the end of the year on Dec 11 2008 this has
grown to 16154.8 billion US$.
A difference of only 404.2 billion US$.
Just scan a few rows, you see every time the past debt is growing.
Conclusion1: The US Federal Reserve is
shipping present debt to the past, why they do this is
not fully understood by me. May be thee are some 'psychology
factors' or 'panic factors'
involved that prevent true reporting of debt to be there.
Conclusion2: When with every report the
Federal Reserve changes debt figures from over six
years ago, it is clear they themselves have laid the axe to the
root of the reliability in their
reporting.
It is rather ridiculous to change the 2002 Q1 debt totals with
every new report...
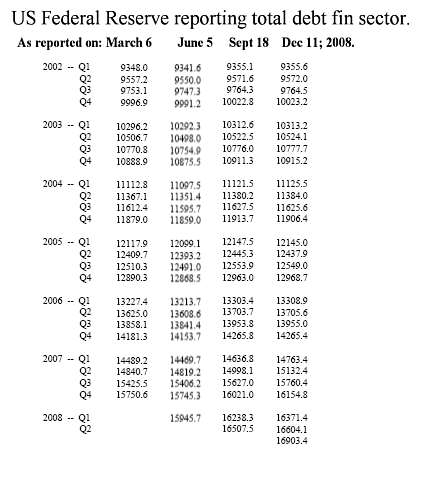
Lets leave it with that for the time being;
DOW at 7000 is what I want and DOW at 7000 is what I will get
with lousy Federal Reserve reporting like this.
__________________________
Update from 18 Dec:
Given the giant transporting debt to the past in the US financial sector (I still do not understand the need for this) lets check if similar stuff is inside US Federal Reserve reporting on for example total US mortgages.
Again I have combined four screenshots from the above linked four pdf files.
Needless to say: In case the US Federal Reserve has some weird need to transport debt to the past, inside mortgages it cannot be big because a lot of folks use statistics like this while zero folks are interested in total debt on the entire US financial sector.
Here is how it looks:
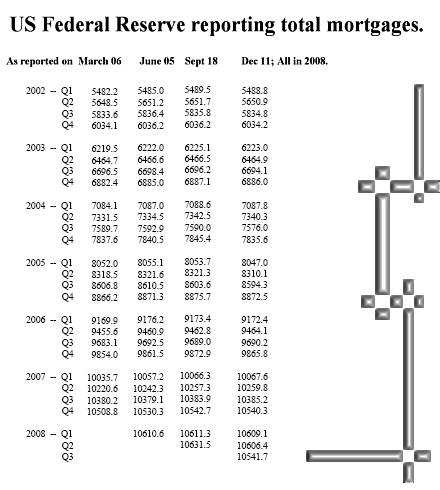
You see: Just like expected there is no
massive transporting mortgage debt to the past.
Ok ok, even the 2002 Q1 total mortgage debt vary from Z1
publication to the next, look at the 2002 Q1 line.
This time maximal transportation of debt is in 2007 Q2: 10259.8 - 10220.6 = 39.2 billion US$ so that is peanuts.
We are only left with one question:
Why is all that long gone debt adjusted with every Z1 release update?
Till updates!
08 Feb 2009: Nice unemployment chart from the office of the Speaker.
Ok after so many weeks it is about high time to update this file again!
I am sorry for the delay, usually at least one or two updates should have been done since the last.
After seven weeks I still do not have a clue as why the reported numbers in the Z1 release by the US Federal Reserve should change that much Quarter on Quarter. It has nothing to do with 'seasonal adjustment' techniques nor does it have anything to do with 'new information coming free'.
So this is the second mystery as found in this entire credit crisis (the first one was mismatches in US Treasuries; there is much more offered for sale compared to actually sold):
Why do the Federal Reserve Z1 debt numbers change every three months???
Back to the present update:
Via Barry's hangout (see this source file) I found a nice graphic from the office of the Speaker comparing unemployment development in the last 3 recessions. It is one of those graphics that completely speak for themselves and as such should work their wisdom into the system.
Here is the cute baby, the green line is the present fun (click on the picture for a larger version):

Till updates; try to estimate total job losses for this year please...!
23 Feb 2009: DOW below 7500 and declining fast...
This update is for 'archiving purposes' only.
I am amazed at the declining speed of the DOW the last days, lets simply post the graph of
today because it speaks for itself.

In the picture below you see the actual contributions of companies in the DOW industrial.
I don't know how reliable this oversight is because you see only one financial company in
it: AIG. American Express topping all other financial institutions?
That is a little surprise don't you think?
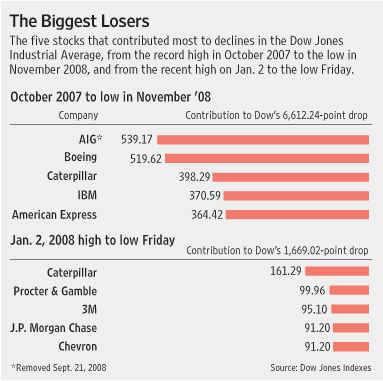
That's it, we are almost there & for the rest no comment (this is only an archiving update).
18 June 2009 : Finally a new update, reposting & stuff like that.
Sorry sorry sorry for not updating so long! (My computer crashed and restoring these files did cause some extra work involved.)
So the DOW has stood under 7000 for a few days begin
March?
It's just a few days, more days are still expected by the way.
So I only repost a graphic that was supposed to be in this file anyway:
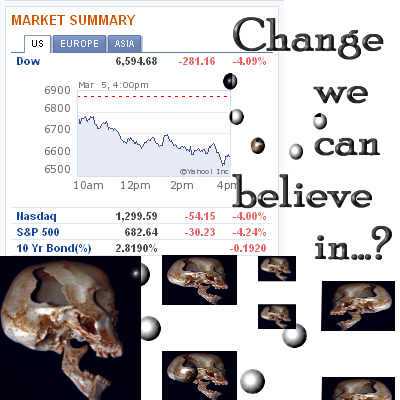
I know this graphic isn't the best I made, but it's funny to see the number 6594.68 again... In case you are interested; the skull is a plastic model.
Now I am reading this file back and to stay on the funny side;
Did I, par accidente, post the first green shoots myself? (See above, picture was from 23 Feb. But when appeared the green shooters on the scene?):
See ya.
__________________________
08 July 2009: The IMF still does not have a clue about the US housing market.
Oh oh oh, here we have one more strange prediction from the International Monetary Fund.
In the past I have complained more than once about
the quality of the IMF predictions and even pointed out to them that they
might have good prediction models but if you feed the models with nonsense
about the US housing market, your predictions
are rather shitty.
It did not help, the IMF just goes on and on with her
weird predictions.
The obvious fact that these weird predictions simply undermine the
credibility of the IMF is not a problem of mine but a pro-
blem of the IMF.
Since I do not hold the entire IMF in some high
esteem, I did not bother to read their entire report. Why go through all
this
trouble if a few Google searches easily zoom in on the nonsense just as
well?
In order to humiliate the IMF I quote from a Media
source from India (yes my dear IMF, a Media source from some developing
nation and not your 'official report'). Quote (source):
The higher growth is dependent on the US economy recovering by September this year. The IMF projects US economy to contract
by 2.6 per cent in 2009 before recovering to 0.8 per cent in next calendar.
“In the US, high-frequency indicators point to a diminishing rate of deterioration, including in the labour and housing markets.
Industrial production may be close to bottoming out; the inventory cycle is turning; and business and consumer confidence has
improved,” the report said.
Thus, the IMF expects the world’s largest economy to stabilise in the second half of calendar 2009, followed by “gradual recovery”
in the following year.
Comment: Only a bunch of idiots use 'high frequency
indicators' for labor and housing markets, you can sample the US housing
market 60 times a second or once a month; what's the difference?
Furthermore industrial production might be bottoming out but does this
imply it will go back to the old levels? Have they never
heard at the IMF
of the next economical axiom?:
After a long period of over consumption, there will be a period of under consumption that is about twice as long as the over consumption period.
At last: Business and consumer confidence are only
statistics of ordinal degree, they have no use beside measuring
'confidence'. Please
remark that year in year out I never ever mention
statistics like these; they are similar to looking at the stars in the sky
& why should
astrology be a pillar of IMF reporting?
In order to wash the ears of that incestual clique
that is known as the IMF I only post a few links on US housing stuff, I
know it will
not help because an incest clique is an incest clique. The
links are all from Barry and it is only some of the stuff Barry posted
today:
Year-Over-Year Change Home Prices, 2001-2009
In case the mental dwarfs from the IMF still don't grasp it (and of course they won't, after all they are only part of the incest clique):
Lets leave this update with that. (High frequency indicators? Please go fuck yourself my dear IMF & don't try to fool me!)
__________________________
24 Nov 2009 The USA gross domestic product grew 2.8%, what does it mean?
This update is a repeat of item number one from 29
Oct on the homepage. In the 29 Oct writing I clearly demonstrated that
profit
growth for the entire US economy only climbed
four billion US$ going from Q2 to Q3 in order to get a 3.5% GDP
growth.
Yes you read it right: Only 4 billion more profits in the real economy is enough to explain the reported 3.5% annualized GDP growth.
Today the USA GDP number was revised to 2.8%...
Therefore I copy & paste the 29 Oct item, quoting:
Item 1) USA GDP a staggering +3.5%!!! But what does it mean?
Today the long awaited US gross domestic
product numbers came out, every body is dancing on the table
because the USA is now out
of a recession!
A lot of other writers already commented on
the details so lets skip that and repeat a similar easy
calculation as was made yesterday
with the housing start
statistics.
Select table 1.1.5 from the next collection of tables:
http://www.bea.gov/national/nipaweb/SelectTable.asp?Selected=N
(Remark I now use the GDP numbers included inflation, you can repeat a similar calculation with the use of table 1.1.6.)
We observe:
2009 Q2 = 14,151.2
2009 Q3 = 14,301.5 (in billions of present dollars).
How much % did it grow?
Simple: 14301.5/14151.2 = 1.0106 or 1.06%
Quarter on Quarter.
That would give an annual growth of 4.3% (again this is included
GDP inflation, the deflator came out at 0.8%
giving the 3.5%
growth number in the news).
Now we simply divide the GDP numbers by four to get the 'non annualized' numbers:
2009 Q2 = 14,151.2/4 = 3537.8
2009 Q3 = 14,301.5/4 = 3575.4 (in billions of present
dollars).
Of course you get exactly the same percentual
growth, only it now looks a less bit spectacular because in
absolute
growth this is only:
3575.4 - 3537.8 = 37.6 billion...
On average the profits from the USA economy
are about 9 to 10%, this leads to the conclusion that total
profits
of the USA economy only grew 4
billion from the second to the third Quarter...
To make this 4 billion profit growth miracle happen, there was a lot of so called monetary and fiscal stimulus done.
Lets only look at the wider statistic of US
Federal deficits, the last time I checked it it was 1.42 trillion.
Of course
the deficits are not spread equal over time because
taxation has large seasonal, monthly and weekly fluctuations.
Yet on average a nice 1420/4 = 355 billion a Quarter...
You observe a little problem here:
Debt growth of the US Federal government only
is about 9 to 10 times the absolute GDP
growth. Furthermore: all
that extra debt has to be repaid
via the extra profits that were only a tiny 4 billion.
Funny detail:
Now we have those ultra low rates that
naturally comes along with an ending fiat money system; the 4
billion in
extra profits are (just) not enough to pay the interest
obligations on the USA debt. But that is theory.
In practice you cannot tax all profits away so it is sheer
impossible this US government debt will ever be paid
off.
End of the long 29 Oct quote.
The updated USA GDP reading
from today says (source www.bea.gov/national/nipaweb/SelectTable.asp?Selected=N
&
select table 1.1.5):
2009 Q2 = 14,151.2
2009 Q3 = 14,266.3 (in billions of present
dollars).
Via a similar calculation (or
estimation) you can estimate that on average total profits of the US
economy only climbed
about 3 billion going from the second to the third quarter of 2009.
I am fully aware of the fact most
Americans can't understand this easy math and as such it is only logical
that you
never hear easy math like that on the USA financial channels. Only bla bla
strong GDP growth will unleash bla bla bla.
In fact what it is in actual profits they don't have a clue...
May be I should change the title of this page a bit and try to guide the DOW to 70,000 instead of 7,000...
__________________________
__________________________