On the zero days it is advised or expected that we have less US slime
killed in Iraq.
On the one days it is advised to kill a bit extra.
Under observation were 94 days ranging from 24 March to (and with) 25 July 2007; 94 days in total.
Battlefield considerations indicate it could be handy if the Iraqis
know beforehand if certain days are a 'zero' or a 'one' kind of day.
Furthermore it is handy to cluster the zero days and the one days since we
have timelag in giving our estimations, that means it is not
very handy to spell out the next week as 0011011. No no, we give a range
of ones and a range of zeros in order to maximize
US death toll.
To give you an idea about how stuff works we have a 'cut and paste' from the main page:
| Date | Daily killed average |
0 or 1 | Motivation for 0 or 1 |
| 24 March - 31 March | 1.50 | 0 | I was offline for two months |
| 01 April - 08 April | 5.25 | 1 | I was back online...;) |
| 09 April - 24 April | 3.31 | 0 | I asked for 'not too much' killed US slime for a period of 16 days... |
| 25 April - 10 May | 3.51 | 1 | 10 May was MBD + the preceding 15 days. |
| 11 May - 21 May | 4.10 | 0 | Well it are the days after an MBD, let's not do difficult |
| 22 May - 31 May | 5.20 | 1 | The very first 'we can reach two consecutive months with triple digit US death toll'. (See archives) |
| 01 June - 10 June | 3.40 | 0 | Rest for 10
days, visit family & friends & things like
that. Prepare for the next '1' |
| 11 June - 25 June | On 23 June daily average stands at 4.15 US slime / day | 1 | Start of the Summer Offensive, shall we give it a name? A name like FuckUSA would be nice but Offensive Iraqi Freedom would also be fitting. |
| 26 June - ??? | ?? | 0 or 1? | Important: When operation Arrowhead Ripper is still going on by the 26th of June we will postpone this statistical testing to the 26th of July. |
My thanks go once more to the Iraqis who have supported this project,
without there help this would have been impossible.
Thanks!
Lets take a look in detail now this introduction runs at it's end.
Since most of my readers are not familiar with statistical testing anyway and the SPSS program in particular it is most wise to make a few screenshots so the info needed to get out will indeed get out.
In order to understand what the next screenshots mean you only have to
understand the meaning of two variables, the variables are named SLIME and
MBDper. Both are simple to understand, when for example SLIME has value 5
on a certain day this only means we had five filled US coffins on a
particular day, so the SLIME vafriable traces the daily US (and coalition)
death toll. Simple or not?
The MBDper stands for 'Military Bloody Day period' has only two values: it
is 'one' (more deaths expected or advised) or it is 'zero' (less dead US
slime is estimated).
So:
SLIME = daily US death toll &
MBDper = the period we are in.
We start this series of screenshots with a very simple one, all days are combined and we only put on the X-axis the daily US death toll and on the Y-axis we put the number of days into our time basis of just 94 days.
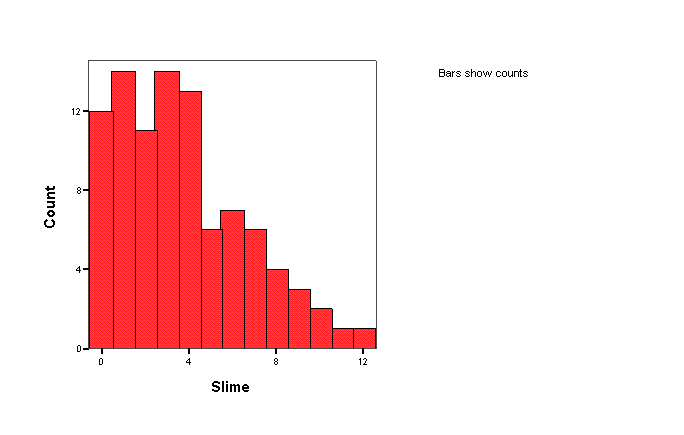
For example you see that during four days we had 8 soldier slime
killed.
For example you see that during one day we had 12 soldier slime killed.
Do you get the point...
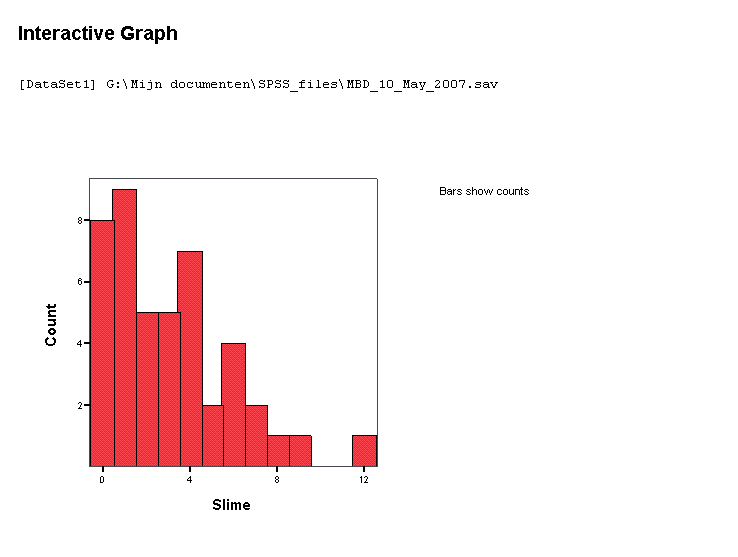
Now how does such a split up look on the so called ´zero´ days you
might wonder.
Well it looks like this...
Where on the ´one´ days statistics break down to
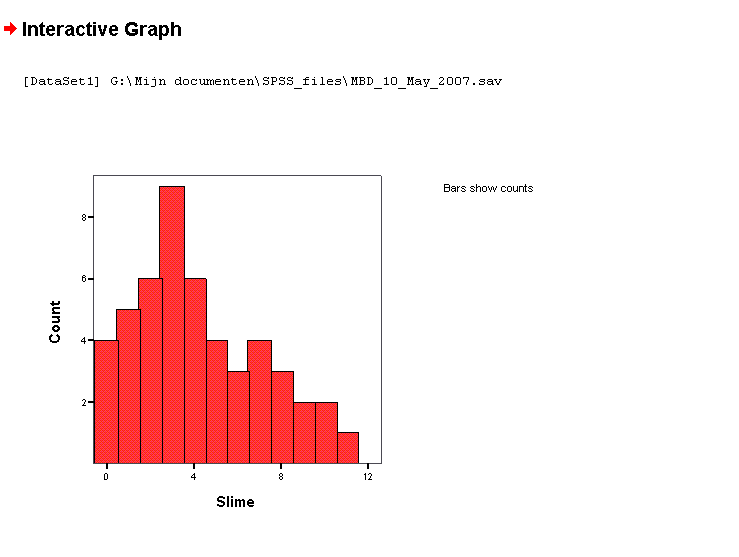
Needless to say there is a great difference between the last two graphs so it is wise to study further what differences there are in particular.
Therefore we take a look at the so called ´descriptives´ inside the SPSS package and we arrive at the next screen shot that says
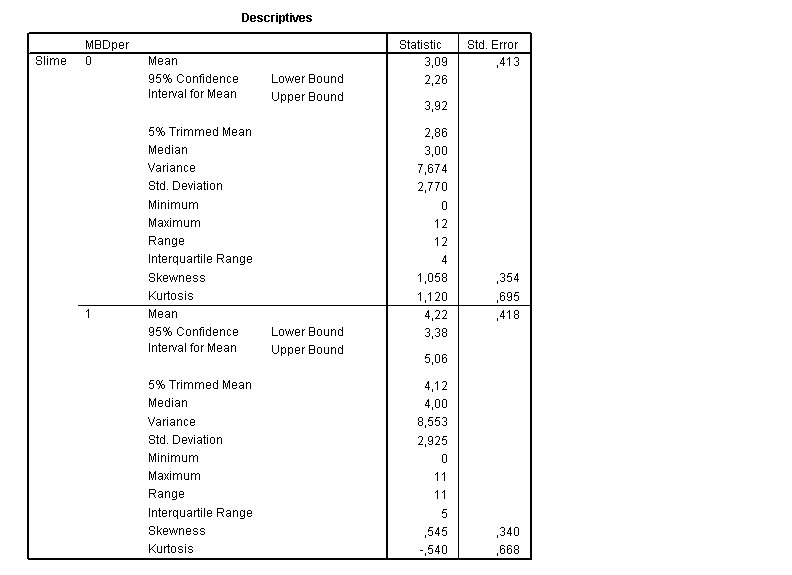
Ah, now we see daily US slime killed is 3.09 in the zero days while it runs at 4.22 in the one days (remark we had 94 days under investigation)
So is there any kind of significance found between these both averages or is the just pure coincidence...
For this to estimate we only have to apply standard scientific knowledge and this knowledge says
H0 There is no difference whatsoever, versus
Ha We might have a problem because the differences are just too big.
Let me spare you the technical details but the next screen shot simply says
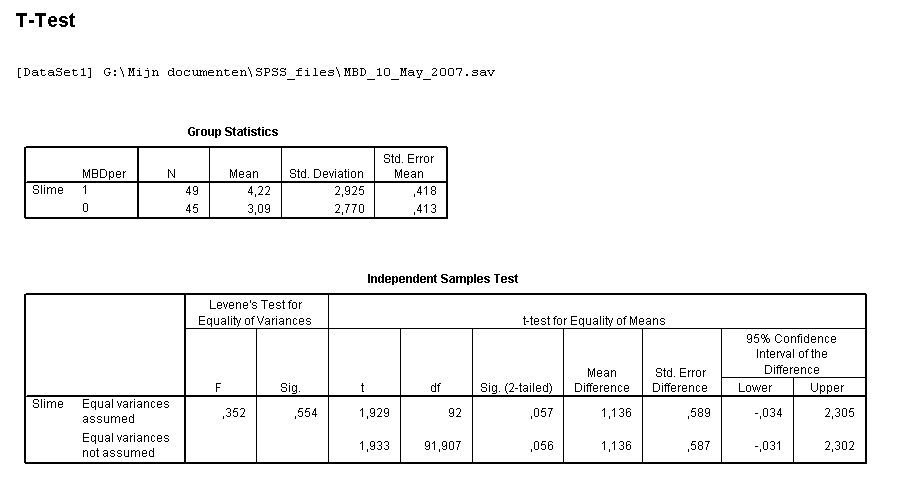
And for the statistical trained eye you only look at the two tailed significance in the upper row, divide it by two to get 0.057 / 2 equals 0,0285.
Therefore my fellow US statisticians will jump to the conclusin that I am in the right where Dubya is telling stupidity.
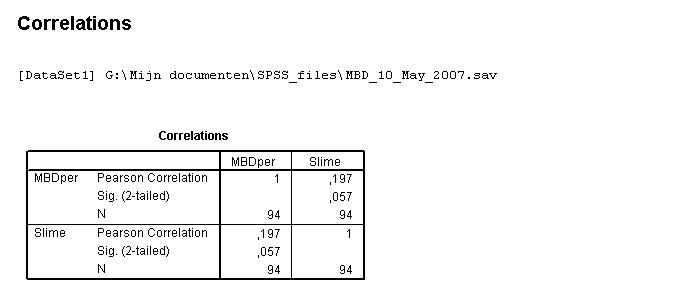
Lets proceed with so called correlations, when we calculate correlations we see once more this 0,057 number propping up.
Here is the screen shot
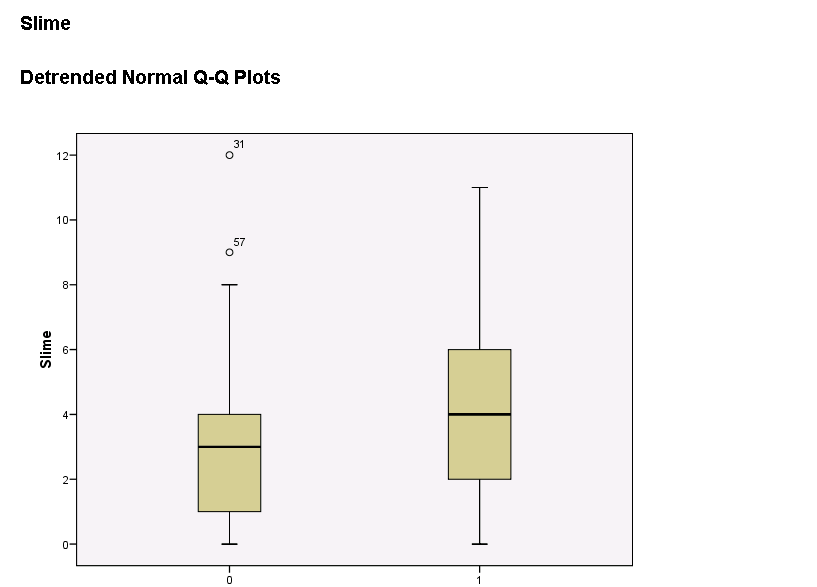
And why not take a look at some box plots (as far as I know it these are 95% threshold boxplots)
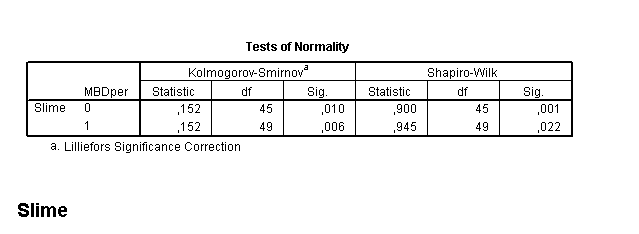
And lets end this update with something I am not familiar with, I only publish this because I am unsure about the real facts. Let me share my worries with you± I thought I had the normal distribution in the back of my car but now a more rigid analysis with help of the Komogorov testing as found in the SPSS package using the explore options has made me more worried...
Lets just place into fact that normality of these battlefield date is still a matter of discussion...
That was it, may be later to be updated.